The fishbone diagram is one of the seven basic quality control tools. Though all these tools have their importance, the fishbone diagram is distinct.
Project managers use this diagram during quality management. The fishbone diagram has many names: the Ishikawa diagram, the Fishikawa diagram, the Herringbone diagram, and the cause-and-effect diagram.
In Six Sigma, you use it in the “Analyze” phase of DMAIC ( define, measure, analyze, improve, and control).
This diagram got the name Ishikawa because Professor Kaoru Ishikawa developed it in 1960. Mr. Ishikawa was a famous expert in quality management.
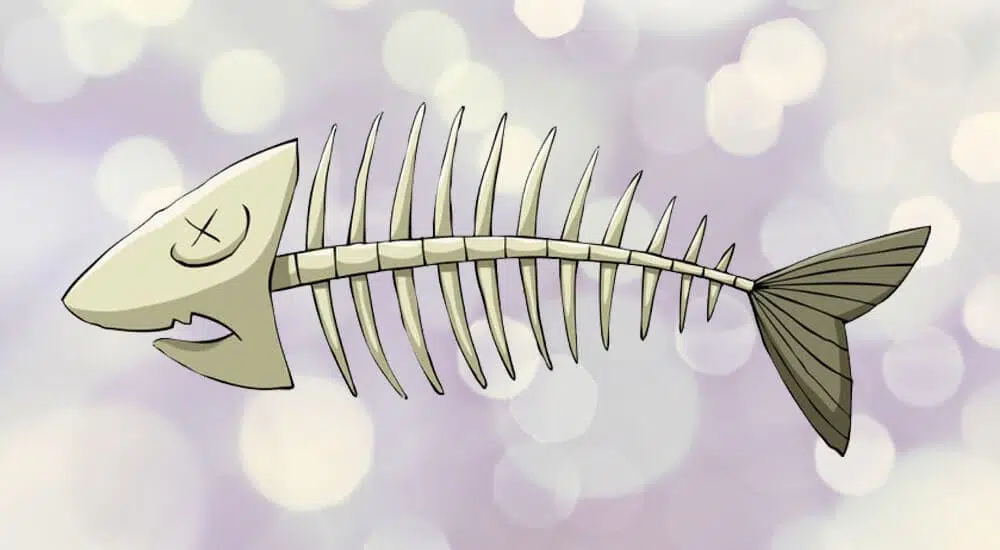
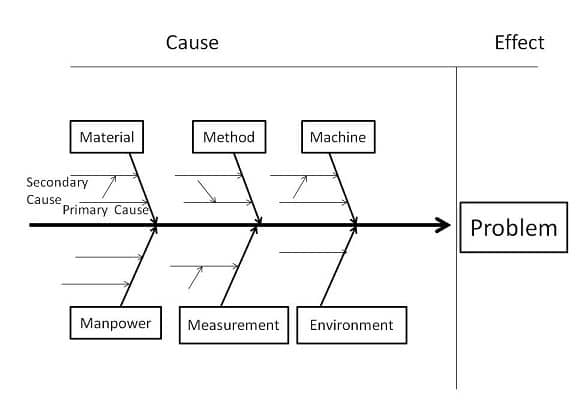
This diagram looks like a fish skeleton; the head is the problem, and the spines are the causes; many experts call it a fishbone, herringbone diagram, or Fishikawa.
Fishbone Diagram
If you have a problem with your process or product, you should know the cause before thinking about a solution.
A fishbone diagram gives you a comprehensive list of causes to find the root of the problem.
This tool provides a better understanding and ensures you don’t just partially solve a problem.
The fishbone diagram uses a brainstorming technique to collect causes and show them graphically. Sometimes, the most apparent factor turns out to be minor, and the one thought to be minor is causing the issue. This diagram allows you to think thoroughly about the root cause, which leads to a healthy and long-lasting resolution.
The fishbone diagram considers all possible causes of a problem instead of focusing on the obvious. It also groups causes to identify the source of the variation.
Categorization of Causes in a Fishbone Diagram
Every industry uses fishbone diagrams; however, they may have different categorizations of causes. You need to customize the category to your requirements.
A few generic categorizations for popular industries are given below.
Manufacturing Industry
You can categorize the factors (causes) by the 8 Ms:
- Machine
- Method
- Material
- Manpower
- Measurement (Inspection)
- Milieu (Mother Nature–Environment)
- Management
- Maintenance
Toyota populated the first six, and two more were added to the list later.
Marketing Field
You can categorize these factors by the 7 Ps:
- Product
- Price
- Place
- Promotion
- People
- Positioning
- Packaging
Service Industry
You can categorize these factors by the 5 Ss:
- Surroundings
- Suppliers
- Systems
- Skills
- Safety
How to Draw a Fishbone Diagram
- Identify the Problem
- Identify and Categorize Causes
- Brainstorm Possible Causes
- Analyze the Diagram
Identify the Problem (Effect)
First, write down the problem. A short brainstorming session is often helpful when the main problem is not straightforward.
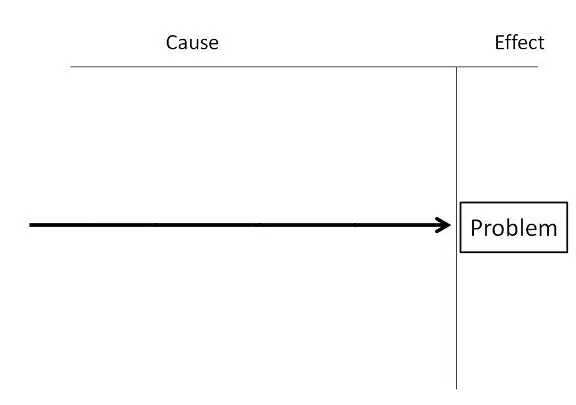
Draw a diagram as shown. Write the problem inside a box and draw an arrow toward the box from the left side of the paper. You will see that it looks similar to the spine and head of a fish. The head of the fish is the problem.
Identify and Categorize Causes
In this step, you will identify all the main factors of the problem and categorize them. If you are having a problem with categorization, use any of the generic headings given above.
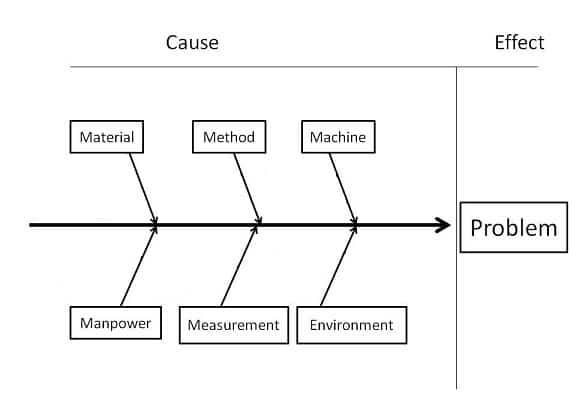
For each factor, draw a line on the fish’s spine as shown in the figure and label each. The factors added are the bones of the fish.
Brainstorm Possible Causes
For each category, brainstorm the possible causes of the problem. You can sub-categorize if needed. While brainstorming, ask yourself questions like “Why does this happen?” Note the answer. Then ask again, “Why does this happen?”
You can add these causes horizontally to the fishbone (factors) and label them. You can continue adding sub-branches until you’re satisfied. This is an important step; spend considerable time here. The collection of causes should be comprehensive.
This technique resembles the “5-Why” approach, which says you can find the root cause by answering “Why?” five times.
Analyze the Fishbone Diagram
When your fishbone diagram is complete, you can see all the possible causes of the problem.
Now, you can further investigate with your team to find the root cause and the solution.
Important Points While Developing a Fishbone Diagram
- You should have a clear understanding of the problem.
- Team members should be experienced and involved with the problem.
- The discussion should be under the project manager.
- Think of all possible causes for each factor and add them to the fishbone.
- If any bone is bulky, try to split it into two or three branches.
Benefits of a Fishbone Diagram
- It is easy to understand and analyze.
- It helps you identify the root cause of the problem.
- It helps you locate bottlenecks in the process.
- It helps you find ways to improve.
- It involves an in-depth discussion of the problem, which informs the team.
- It prioritizes further analysis and helps you take corrective action.
Limitations of a Fishbone Diagram
- A fishbone diagram does not single out the root of the problem because all causes look equally important.
- Efforts can be wasted on identifying causes that have little effect on the problem.
- A fishbone diagram is based on opinion rather than evidence.
- This process democratically selects the cause, which is not always effective.
- If the discussion is not controlled, you can get incorrect results.
The worthiness of a fishbone diagram depends on the expertise of team members. If they are not experienced, finding the root cause of the problem will be difficult.
Therefore, involve experienced experts and ask many “whys.” Up to “five whys” is enough.
Summary
A fishbone diagram is a vital tool in identifying the root cause of a problem. Although it is time-consuming, the benefits are enormous. This tool helps you remove the root cause of the problem and develop an understanding among team members. You use the fishbone diagram with a critical problem because you cannot spend time on every small issue.
Do you use fishbone diagrams in your project? What categorizations have you used, and what was your experience? Please share with us in the comments sections.

I am Mohammad Fahad Usmani, B.E. PMP, PMI-RMP. I have been blogging on project management topics since 2011. To date, thousands of professionals have passed the PMP exam using my resources.


Thanks so much fahad for these brilliant materials. I would like if you will provide also notes for principles of good laboratory practice. Thanks
Hello Juviann, this blog is the PMP exam preparation. If you have any topic related to the PMP exam, let me know, I will try to write on it.
Thanks. How about the elements of risk control and the profit model
Hello Juviann, I did not understand your question.
Please show me how to draw diagram for delay to hand over the construction project on time because of supply chain issues
Sorry Nilantha, I don’t have any example of it.
Traditional methods of Process Improvement demonstrate high failure rates: Business Process Reengineering (BPR) 50% TO 85%, Total Quality Management (TQM) 75% and Six Sigma 90% Proactive methods used in Process Reliability Modeling (PRM) will identify organizational issues before they result in loss of revenue. Traditional methods of Process Improvement demonstrate high failure rates: Business Process Reengineering (BPR) 50% TO 85%, Total Quality Management (TQM) 75% and Six Sigma 90% Proactive methods used in Process Reliability Modeling (PRM) will identify organizational issues before they result in loss of revenue.
When did you post this?
July 2014.
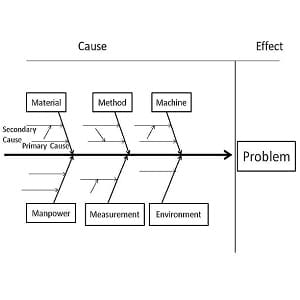
Also the slanted and straight arrows on the fishbone side arrows, what do these indicate?
Refer my reply to your previous comment.
Fahad, can you please explain what does the primary cause and secondary cause on the same branch indicate?
A Primary Cause is one that could lead directly to the effect. For example, a glass that was prematurely leaked water might be caused by a sudden jarring motion such as dropping, which might be listed under the category People if it was associated with handling by a person.
A Secondary Cause is a cause that could lead to a Primary Cause, but does not directly cause the end effect. For example, the cause slippery hands doesn’t make the glass leak water, but it could lead to the glass being dropped. So slippery hands would be listed as a secondary cause under dropping.
Read more at…
https://www.edrawsoft.com/fishbone-diagram-analysis.php
Really good and explicit explanation. I found it very useful and has helped my understanding as I proceed to write my final project. Thank you,
You are welcome Dorika.
Dear Fahad
Can you please throw some light on Pareto charts, especially on Seven Basic tools on quality
thanks n advance
mahesh
Okay. I will write on it soon.
Dear Fahad
The details you have given is crisp and very knowledgeable, to understand.
one really gets hold of the topic after going through once.
my question is how much of it required from PMP exam point of view? do we got to draw and analyse the Fish bone concepts in questions asked?
Thank you in advance
You only need to know the fishbone diagram and its usage. Anyway, more knowledge will not hurt you.
Do you have any excels for creating Earned Value in a Project i could leverage for a fixed Fee Project Please. This project has a project plan but no resources tied to Project plan with proper allocation and r rates. for first 6 months individuals did not even track time so hard to figure out unless i calculate by role and rate …thoughts need your assistance.
Sorry Charlie, I don’t have any excel template for this thing.