A RACI chart is a vital project management document and a useful tool for project managers. This project document is often known as the “RACI matrix” because it visually looks like a matrix. This chart helps stakeholders see team members’ roles and responsibilities for all project activities and tasks.
A RACI chart helps reduce project conflicts. It allows stakeholders to see their roles and responsibilities so they won’t interfere with other team members’ roles. It ensures smooth communication among stakeholders and facilitates easier decision-making.
In today’s blog post, I will explain RACI charts in detail, including an example and their pros and cons.
Let’s get started.
What is a RACI Chart?
A RACI chart is a type of responsibility assignment matrix in project management that shows each stakeholder’s responsibility and assignment on a chart. This chart can be an Excel sheet or a simple Word table with stakeholders in one column and others showing their involvement with the task using the letters R, A, C, and I.
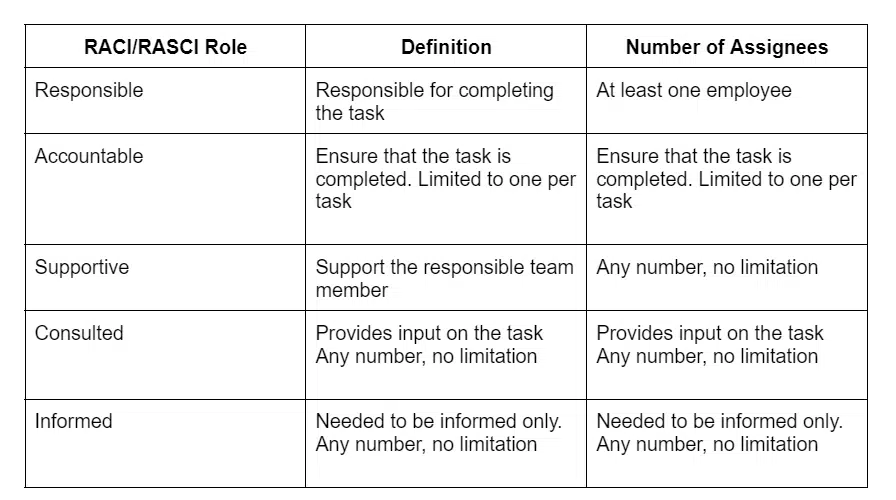
RACI stands for “responsible,” “accountable, “consulted,” and “informed.”
Responsible
These stakeholders or groups of stakeholders are responsible for the assigned tasks. They complete the task, and each task has at least one responsible stakeholder. Responsible stakeholders are mostly the project team members.
Accountable
These stakeholders ensure the responsible person can complete the task on time, as expected. Each task has only one accountable stakeholder. These stakeholders belong to the project team and hold high positions.
Consulted
These are the stakeholders whose feedback is necessary to complete the task. They are interested in the project or its deliverables and can affect the project if their requirements or feedback are not considered.
These stakeholders include project sponsors, clients, management, etc. Not all tasks require this role, but if one is required, you must ensure that you provide a consultant.
Informed
These stakeholders only need to be informed about the task’s progress. They can be low-power or low-interest stakeholders; you only have to inform them. These stakeholders are generally outside the project team or organization, such as the local community.
Not every task has an informed role assigned to it.
A RACI chart outlines each team member’s duties, tasks, and expectations. This helps avoid conflict, as no two team members will fight over any one assignment. They will be motivated, take ownership of their tasks, and perform better.
RASCI Model: A RASCI chart is a popular variant of a RACI chart. Only one extra role has been added: “Supportive.” This role supports the “responsible” team member in completing the task.
When Should You Use a RACI Matrix?
You should use a RACI chart for all projects, regardless of size and complexity.
For example, during a project, I was responsible for preparing the daily progress report, getting it signed by the client, and submitting it to our project administrator. The project administrator was responsible for preparing a summary report and sending it to management for their information (i.e., their role was “informed.”)
A RACI chart is important for complex projects so that stakeholders can find the right team member to contact if any task is delayed and requires immediate attention.
A RACI chart can help you answer these questions:
- Who should I contact to get the job done?
- Who should approve this request?
- Who has final authority on the production release?
- Can I copy this stakeholder on the email?
- Why was I not informed of this change?
Example of a RACI Chart and How to Create it?
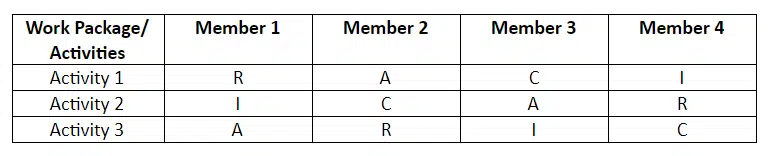
Creating a RACI chart is easy. List all project tasks in the first left column and role in the top row. Now, enter RACI for each task in the corresponding cell, as shown in the above image, and you are done. You can create the above chart in Excel or Word.
You can use color coding to make your RACI chart interactive and quickly see the important details. You can quickly determine if any team member is overwhelmed with too many assignments or tasks and has more than one accountable stakeholder.
Based on the above steps, let’s construct a RACI chart for a project involving an Agile Scrum Team.
First, identify a work package or activities, such as:
- Scope Definition
- Product Backlog Maintenance
- Sprint Planning
- Backlog Refinement
- Daily Stand-Up Meeting
- Sprint Review
- Sprint Retrospective
- User Story Development and Testing
- Code Deployment
- Sprint Metrics
The next step is identifying the team members, teams, or job titles.
The job titles are:
- Scrum Master
- Product Owner
- Development Team
- Project Manager
- Program Manager
- Project Sponsor
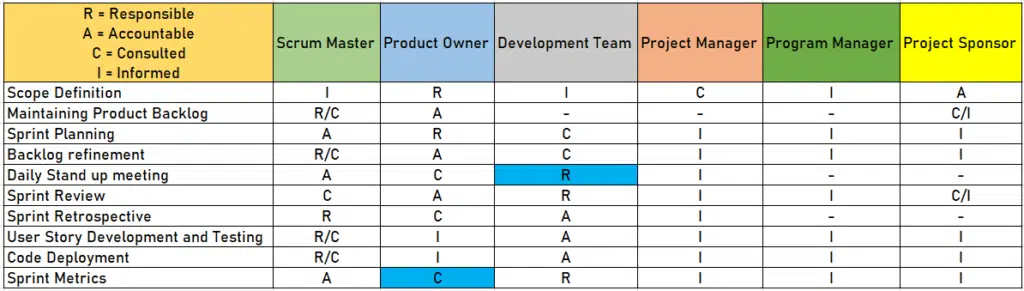
With this information, a RACI chart can be constructed as shown below:
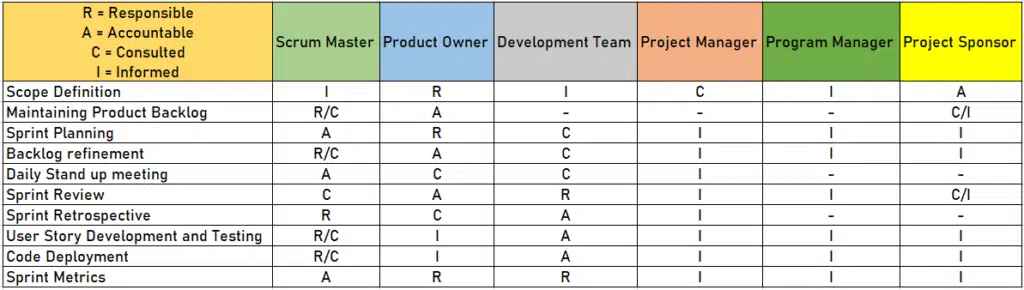
Only one team member can be accountable for a task. If the task is big, more than one “responsible” can be assigned. There can also be many consulting roles, and the task can have the highest number of informed stakeholders.
After preparing a RACI chart, you will analyze each cell for roles and responsibilities. This will remove ambiguities when assigning roles for work packages or activities.
After scanning the chart, you can see that no “R” is assigned to the Daily Stand-up meeting. The development team is responsible for this meeting, sharing updates such as completed work, planned work for the next day, etc. They should be assigned “R” and not “C.”
Likewise, Sprint Metrics has “R” assigned to both the Product Owner and Development Team and no assignment of “C.” This confuses who is responsible for this activity. The Product Owner could be consulted since the development team works on the Sprint tasks to help arrive at the metrics. Hence, “R” for the Product Owner could be changed to “C.”
Once these changes are made, the updated RACI chart will look like this:
It is important to review the RACI chart regularly and keep it updated. You must communicate any changes to the RACI chart to stakeholders.
The following are the best practices to create a RACI chart:
- Limit the number of “Responsible” and “Accountable” roles to one per single activity or work package. This will help avoid conflict or accountability for each task or work package.
- Assign “Responsible” and “Accountable” roles in every row. Each activity must have a “Responsible” and “Accountable” role.
- Share the RACI chart with team members and ensure that they understand it to avoid any issues at later stages. Always keep the RACI chart updated.
- Limit the number of “Consulted” roles. The more consultation roles there are, the more time consultation will take, and the more project progress will be affected.
Advantages and Disadvantages of a RACI Chart
The benefits of the RACI matrix outweigh the drawbacks. But I will provide both.
Advantages
- Work Assignment Clarity: Once the roles are defined, team members will not step on each other’s toes. Work will continue within the defined boundaries, making project delivery seamless and less challenging.
- Workload Understanding: The chart will show whether a team member is overloaded or can be assigned more tasks. For instance, a worker who is assigned multiple duties may not do them well since they must juggle their time to complete them all. Thanks to the chart, the project manager will have the information they need to make changes. The chart shows whether team members work beyond their limits due to overload.
- Team Organization: The team will function more efficiently when everyone knows their duties and responsibilities. As tasks are assigned to the appropriate team members, achieving a shared goal will become more feasible. Since the team will have created the RACI chart collaboratively, there won’t be any future conflicts.
- Smooth Transition: Employee turnover is a concern in any organization, and when it happens, project managers seek a smooth transition of employees into and out of their projects. A well-defined RACI chart can facilitate smooth handoffs between staff in certain situations.
- Organizational Objective Alignment: A RACI chart can help convey the organization’s overall objectives to employees at all levels. Each team member will be aware of their contributions when attaining organizational aims and objectives.
- Improved Stakeholder Engagement: With a clear definition of roles and responsibilities, the team will know which stakeholders need to be consulted or informed, and they will share their progress accordingly.
- Self-Organization Promotion: Once the RACI matrix is shared with the team, self-organization becomes simpler because the responsibilities are clearly defined and outlined, thus increasing stakeholder participation.
Disadvantages
- In larger projects, a RACI matrix can add complexity.
- While RACI helps define roles, it does not demarcate the relationships between project team members.
- If a particular task has more than one “R” (i.e., “Responsible”), then confusion may arise about who is responsible for the task or action.
- Not all tasks can be captured in a RACI matrix.
- It is time-consuming to break down tasks granularly and assign owners accordingly.
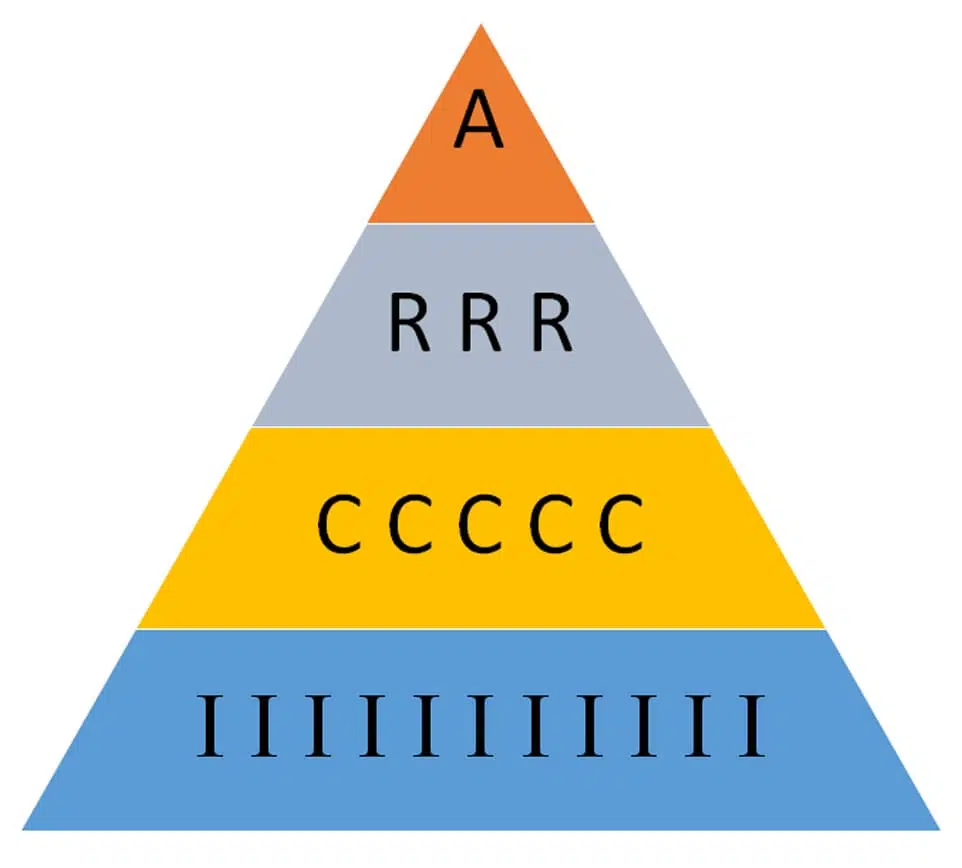
RACI Triangle: The RACI triangle shows the roles for each task.
RACI Matrix Alternatives
Some popular RACI matrix alternatives are:
- RASCI Chart: This chart is also known as the “RASCI matrix.” The letter “S” is added, which means “Supportive.” This role supports responsible team members in completing the task. They are not responsible for the outcome.
- DACI Chart: DACI stands for “Driver, Approver, Contributor, Informed.” This chart mainly outlines the project’s decision-making roles and responsibilities. The project manager mostly plays the “Driver” role by guiding the team to a decision.
- RAPID Chart: RAPID stands for “Recommend, Agree, Perform, Input, Decide.” This decision-making framework is also used to define authority vs. accountability. The “Recommend” role suggests action, and the “Decide” role makes decisions.
- CARS: CARS stands for “Communicate, Approval, Responsible, and Support.” This model categorizes stakeholders according to their role in the project. “Communicate” means people who are consulted and informed. The “Approval” role is for the decision maker. The “Responsible” team member does the work, and the “Support” members support the responsible team members in completing the job.
- CLAM: CLAM stands for “Contribute, Lead, Approve, and Monitor.” “Contribute” does the work; “Lead” people are accountable for the task; “Approve” people are decision-makers; and “Monitor” people are those who are being monitored throughout the project.
Some other, less commonly known RACI chart alternatives are:
- ARCI: Accountable, Responsible, Consulted, Informed
- PACSI: Perform, Accountable, Control, Suggest, Informed
- RACIQ: Responsible, Accountable, Consulted, Informed, Quality Review
- RACI-VS: Responsible, Accountable, Consulted, Informed, Verifier, Signatory
- CAIRO: Consulted, Accountable, Informed, Responsible, Omitted
- RATSI: Responsibility, Authority, Task, Support, Informed
Conclusion
A RACI chart is a key tool in project management that clarifies stakeholders’ roles and responsibilities. By defining who is “Responsible,” “Accountable,” “Consulted,” and “Informed” for each task, you can execute projects efficiently, with reduced conflicts and confusion, as well as improved communication. RACI charts ensure accountability, produce better teamwork and increase the chances of project success.
This topic is important from a PMP exam point of view.

I am Mohammad Fahad Usmani, B.E. PMP, PMI-RMP. I have been blogging on project management topics since 2011. To date, thousands of professionals have passed the PMP exam using my resources.