The benefit-cost ratio is a simple way to judge whether a project is worth doing. It is a part of cost-benefit analysis. It compares expected benefits with total costs and shows the value in a single, clear number. Project managers and sponsors often rely on the benefit-cost ratio during project selection and business case reviews. The benefit-cost ratio is also known as the cost-benefit ratio.
A higher BCR means benefits outweigh costs, while a lower result signals caution. In project management, the benefit-cost ratio supports better decisions when budgets are tight and choices matter.
This blog post explains the benefit-cost ratio step by step, including its meaning, formula, and real examples. You will also learn how to interpret BCR results and avoid common mistakes when using this technique.
What is the Benefit-Cost Ratio?
The benefit-cost ratio compares the present value of all benefits to the present value of all costs. Put simply, it tells you how many dollars of value you get for every dollar you spend, adjusted for the time value of money. A ratio above 1 means the benefits outweigh the costs; below 1, the opposite.
BCR values fall into three ranges: less than one, equal to one, and greater than one. When the ratio is below one, discounted benefits are smaller than discounted costs, implying a loss. A ratio of around 1 suggests the project barely breaks even, and a ratio greater than 1 indicates a profitable option.
But numbers alone do not tell the whole story. Many public agencies set minimum thresholds. For instance, Federal Emergency Management Agency (FEMA) projects usually require a BCR above 1.0, while the U.S. Army Corps of Engineers requires a BCR of 2.0 or more. Studies by FEMA and the National Institute of Standards and Technology found that resilience investments often have BCRs of 4:1 or higher, up to 11:1. These benchmarks show that high ratios are achievable when projects deliver substantial long-term benefits.
Why Use BCR in Project Management?
Project managers rely on several financial metrics. Net present value (NPV) sums up all discounted cash flows to produce a single number, but it doesn’t reveal the relative size of benefits and costs. The benefit-cost ratio fills that gap by translating absolute amounts into a proportion.
Because it is a relative measure, BCR is helpful for comparing different projects or investment alternatives. A project with modest net profits but low initial costs may have a higher BCR than a large project with bigger profits and higher spending. This insight is important when resources are limited, and you need to prioritize. Using BCR also reveals how sensitive a project is to changes in assumptions; small profit margins coupled with high costs yield lower ratios, signaling greater risk.
How to Calculate the Benefit-Cost Ratio
Calculating the BCR involves four key steps:
- Gather cash flow forecasts. Estimate the future benefits (inflows) and costs (outflows) for each period. Benefits include revenues, savings, and increased asset values. Costs cover investments, operating expenses, and disposal costs.
- Choose an appropriate discount rate. The U.S. Department of Transportation recommends using a real discount rate of 3.1% for federal infrastructure projects. This reflects the time value of money and removes inflation. When analyzing greenhouse gas emissions, a lower rate (around 2%) may apply.
- Compute the present value (PV) of benefits and costs. For each period, divide the cash flow by (1 + i)^t, where i is the discount rate and t is the year number. Sum all discounted benefits to get the PV of benefits. Repeat for costs.
- Divide PV of benefits by PV of costs. The resulting ratio is the BCR. Both PV amounts should be positive; if you used negative numbers for costs or benefits, multiply the result by -1 to correct the sign.
BCR Formula and Components
The formula for the benefit-cost ratio is simple:
PV of benefits / PV of costs
where the PV of benefits equals the sum of discounted benefits and the PV of costs equals the sum of discounted costs. These components depend on the cash flow and the chosen discount rate. The following infographic summarizes the formula and its elements:

Each term in the formula plays an important role. Benefits can include increased sales, cost savings, avoided damage, or any other monetized advantage. Costs cover both upfront investments and ongoing expenses. The discount rate reflects the opportunity cost of capital and risk; a higher rate reduces the weight of future cash flow. Finally, the time horizon ensures that benefits and costs are compared over the same period.
Example: Calculating BCR Step by Step
Suppose your organization is considering three software upgrade options. To keep the example simple, let’s examine one option with the following forecasts:
- Costs: $3,000 today, $3,000 in year 1, $2,500 in year 2, $1,000 in year 3, and $500 each in years 4 to 6.
- Benefits: $3,000 in year 2, $4,000 in years 3 and 4, and $3,000 in years 5 and 6.
Using the 3.1% discount rate recommended by the U.S. Department of Transportation, you discount each cash flow back to today. The present value of costs is $9,238, while the present value of benefits is $11,003. Dividing benefits by costs yields a BCR of 1.19. This result suggests that every dollar spent generates about $1.19 in value.
The following infographic shows this calculation visually:
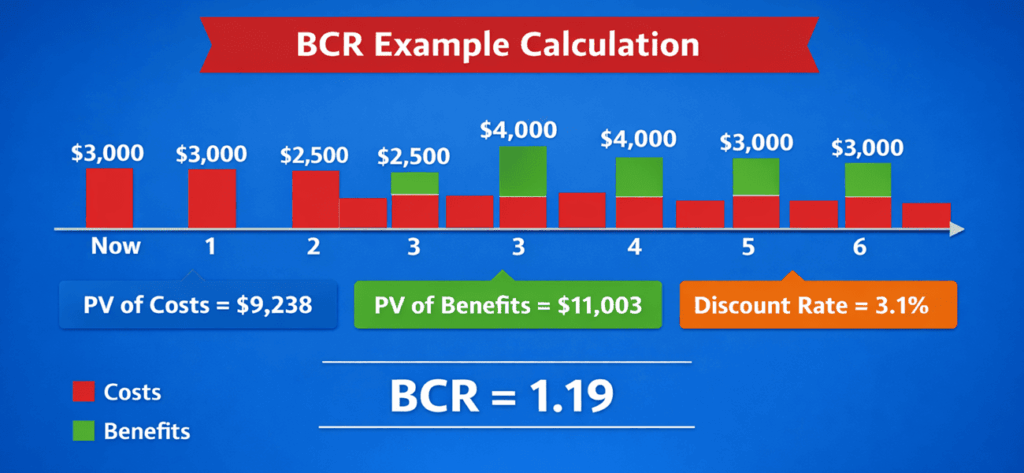
This simple example demonstrates how the timing of cash flows influences the ratio. The project requires heavy spending early on, but the benefits arrive later. Discounting reduces the value of the later benefits, yet the overall ratio remains above one, indicating that the project passes the profitability test.
Advantages and Limitations of BCR
The benefit-cost ratio offers several advantages for decision makers:
- It converts absolute amounts of benefits and costs into a single proportion, making it easier to compare options.
- Focusing on discounted values reflects the time value of money.
- It helps gauge the riskiness of net cash flows. A project with a small profit margin may appear riskier than one with a wide margin.
- It complements measures like NPV by showing the ratio of benefits to costs rather than a net amount.
Despite these strengths, BCR has notable limitations:
- It doesn’t reveal liquidity or the timing of expenditures. A project may have a high ratio but still strain cash flow.
- Results depend on assumptions about discount rates, residual values, and cash flow forecasts. Small changes in assumptions can significantly alter the ratio.
- The ratio only captures monetized benefits. Social or environmental benefits that are hard to price may be undervalued or excluded.
- The method can reinforce inequities. Guidance for climate adaptation notes that benefit-cost analysis tends to prioritize property values over people and may underfund rural or low-income communities. Agencies are updating methodologies to address these concerns.
Knowing these limitations reminds us to use the ratio as one tool among many. Pair it with sensitivity analyses, equity considerations, and qualitative judgment.
Practical Considerations and Best Practices
Economic analysis evolves with new guidance. When performing a benefit-cost analysis, consider the following practices:
- Use up-to-date discount rates. The U.S. Department of Transportation recommends a 3.1% real discount rate for most monetized costs and benefits. A 2% rate applies to carbon dioxide emissions. Check the latest guidance from your funding agency.
- Limit the analysis period. Avoid projecting more than 30 years into the future. For projects such as equipment purchases or software upgrades, shorter periods of 7 to 15 years may be more realistic.
- Document assumptions clearly. Explain the source of your cash flow forecasts, the rationale for the discount rate, and any residual value assumptions. Sensitivity analyses help readers understand how changing inputs affect the ratio.
- Consider non-monetary benefits. When benefits cannot be easily monetized, describe them qualitatively or use multi-criteria analysis alongside BCR.
- Compare multiple metrics. Combine BCR with NPV, internal rate of return, and payback periods to provide a balanced view.
FAQs
Q1. What is the difference between BCR and NPV?
The net present value sums discounted benefits and costs to give a single number. The benefit-cost ratio divides the same values to show their proportion. They often lead to similar rankings but offer distinct perspectives.
Q2. How do I choose the discount rate?
Use a rate that reflects your organization’s cost of capital and risk. For U.S. federal projects, a real rate of 3.1% is recommended. Check if your funding agency provides a specific rate.
Q3. Can non-monetary benefits be included?
Yes. You can estimate their monetary equivalent or describe them qualitatively. For climate resilience projects, agencies increasingly account for social and environmental benefits that were previously overlooked.
Q4. What is considered a good BCR?
A ratio above 1.0 indicates benefits exceed costs. Some agencies require higher thresholds; for example, the U.S. Army Corps uses 2.0, and resilience studies report ratios as high as 11:1. Context matters.
Summary
The benefit-cost ratio helps decision-makers compare value and cost clearly. It shows whether the benefits justify the effort and money spent. A ratio above one signals value, while a lower result warns of risk. Still, BCR should not stand alone. Use it with NPV, risk analysis, and strategic goals. Good input matters, so estimates must remain realistic. When used well, the benefit-cost ratio supports smarter project choices and stronger business cases.
Further Reading:

I am Mohammad Fahad Usmani, B.E. PMP, PMI-RMP. I have been blogging on project management topics since 2011. To date, thousands of professionals have passed the PMP exam using my resources.