Standard deviation and variance are statistical concepts used in all fields (e.g., finance, manufacturing, and project management). Both metrics measure the variability within a dataset. You can determine whether a process or production has volatility using variance and standard deviation.
While they convey similar insights, there is a key difference between them. Variance represents the average of the squared differences from the mean, whereas standard deviation is the square root of the variance.
Standard Deviation
The standard deviation shows how far a group of numbers is from the mean. Simply, it indicates how far apart numbers are from the mean and one another. Calculate the variance and then take its square root to find the standard deviation.
Because it is in the same units as the original data, it gives a clearer sense of how much data values deviate from the mean. This makes standard deviation a more useful metric for understanding variability.
Standard Deviation Formula
The formula for the population is as follows:

Here,
X = The value of the data distribution
u = population mean
N = Number of observations
The standard deviation formula for sample data is as follows:

Here,
x bar = Sample mean
n = Number of observations
Variance
A variance also shows the data dispersion from the mean and one another. It is the average of squared differences from the mean. To calculate the variance, find the difference between the data set and the mean, square them, add them, and take the average.
A larger variance indicates that data points are widely spread around the mean, while a smaller variance suggests that they are more closely clustered.
Variance Formula
The variance formula measures the dispersion of a set of values. It is calculated differently for a population and a sample:
Population Variance
Population variance measures the spread of an entire population’s data. It is calculated by finding the average of the squared differences between each data point and the population mean.

Where N is the total number of data points in the population.
Sample Variance
Sample variance estimates the spread of a subset (sample) of data taken from a larger population. To account for the smaller size and better represent the population, the formula divides by n – 1 instead of n.
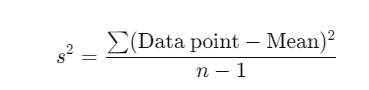
Where n is the number of data points in the sample.
Population variance uses the actual population size divided by N. Sample variance adjusts for a smaller dataset by dividing by n-1 to avoid underestimating the entire population’s true variance.
How to Calculate Variance and Standard Deviation
Here are the steps to calculate variance and standard deviation:
Step 1. Calculate the Mean
- Sum all the values in the data set.
- Divide the sum by the total number of data points to find the mean.
Step 2. Calculate the Differences from the Mean
- Subtract the mean from each data point.
Step 3. Square the Differences
- Square each of the differences calculated in Step 2.
Step 4. Find the Average of the Squared Differences (Variance)
- Add up all the squared differences.
- Divide this sum by the number of data points for a population variance or by the number of data points minus 1 for a sample variance.
Step 5. Calculate the Standard Deviation
- Find the square root of the variance to obtain the standard deviation.
Standard Deviation vs. Variance
The following table shows the key differences between standard deviation and variance.
| Parameter | Variance | Standard Deviation |
| Definition | The average of the squared differences from the mean | The square root of the variance |
| Units | Squared units of the data (e.g., if the data is in meters, then the variance is in square meters) | Same units as the data (e.g., meters) |
| Analysis Use | Measures the spread of the data points around the mean | Measures the average distance of data points from the mean |
| Interpretability | Harder to interpret directly because of squared units | Easier to interpret because it is in the same units as the data |
| Relationship | The variance is the square root of the standard deviation | Standard deviation is the square root of the variance |
| Outlier Sensitivity | Sensitive to outliers since large deviations are squared | Also sensitive to outliers, but less so, as compared to the variance |
Standard Deviation Vs Variance
Let’s take an example to show the difference between standard deviation and variance with a small data set.
Data Set:
Values: 2, 4, 4, 4, 5, 5, 7, 9
Step 1: Calculate the Mean
Mean=(2+4+4+4+5+5+7+9)/8=5
Mean=5
Step 2: Calculate the Variance
For each value, subtract the mean and then square the result. After that, take the average of these squared differences.
| Value (x) | (x – u) | (x – u)2 |
| 2 | 2- 5= -3 | (-3)2=9 |
| 4 | 4 -5= -1 | (-1)2=1 |
| 4 | 4 – 5= -1 | (-1)2=1 |
| 4 | 4 – 5= -1 | (-1)2=1 |
| 5 | 5 – 5=0 | 02=0 |
| 5 | 5 – 5=0 | 02=0 |
| 7 | 7 – 5=2 | 22=4 |
| 9 | 9 – 5 =4 | 42=16 |
The sum of squared differences = 9+1+1+1+0+0+4+16=32
Variance for a Population:
Variance=32/8=4
Step 3: Calculate the Standard Deviation
Standard deviation ? is the square root of the variance:
Standard Deviation= square root of 4=2
- Variance = 4
- Standard Deviation = 2
Interpretation:
- The variance (4) represents the average of the squared differences from the mean, but it is in squared units.
- The standard deviation (2) is in the same units as the original data, which makes it easier to interpret. It tells us that, on average, the data points are 2 units away from the mean.
Why is Standard Deviation More Commonly Used?
Although variance and standard deviation offer insights into data variability, standard deviation is preferred for its simplicity and practical interpretability. Since it is in the same units as the data, analysts and decision-makers can easily relate it to the context of the problem.
For example, if measuring heights in centimeters, a standard deviation of 5 cm directly indicates the deviation from the mean, whereas variance (in square centimeters) would be less meaningful.
Frequently Asked Questions
1. Are standard deviation and variance the same?
No, variance and standard deviation are related but not the same. Variance measures the average of the squared differences from the mean, while standard deviation is the square root of the variance, providing a result in the same units as the data.
2. Why is standard deviation better than variance?
Standard deviation is easier to interpret because it is in the same units as the original data, while variance is in squared units, making it less intuitive.
3. How do you convert variance to standard deviation?
To convert variance to standard deviation, simply find the square root of the variance.
Summary
Variance and standard deviation are key statistical measures of data dispersion, but they differ in interpretation and application. Variance calculates the average of squared differences from the mean, offering insight into how spread-out data points are, but its squared units make it harder to interpret. Standard deviation is the square root of variance in the same units as the data, making it more practical for understanding variability.
Both metrics are interconnected. Standard deviation is preferred for clarity, while variance is essential in many statistical formulas and models. Together, they provide a comprehensive view of data variability.
Further Readings:
References:
- Standard Deviation and Variance
- Variance, standard deviation, and standard error
- What is Variance?
- What is Standard Deviation?
This topic is important from a PMP exam point of view.

I am Mohammad Fahad Usmani, B.E. PMP, PMI-RMP. I have been blogging on project management topics since 2011. To date, thousands of professionals have passed the PMP exam using my resources.