Managing risks is a key part of successful project management. Every project faces uncertainty, and without a clear method, risks can easily affect your project’s objective and hinder its progress. The probability and impact matrix is a simple tool that helps you evaluate and prioritize risks based on their likelihood and severity. It gives you a clear visual view of which risks need urgent attention and which can be monitored.
By using this approach, you can make better decisions, allocate resources wisely, and stay prepared.
In this blog post, I will explain how the matrix works and how you can use it to improve your project outcomes.
Key Takeaway
- A probability and impact matrix ranks risks by combining their likelihood of occurring (probability) with the potential harm they could cause (impact).
- You can design the matrix using a cardinal scale (numeric values) or an ordinal scale (descriptive terms like low, medium, and high).
- Recent studies show that projects with risk monitoring practices have nearly twice the success rate of those without, and executives are investing more in analytics and automation to improve risk oversight.
- Building and maintaining a matrix helps you focus your limited resources on the most significant threats while keeping a watchlist for lower-priority risks.
What is a Probability and Impact Matrix?
A probability and impact matrix is a simple tool used in project management to assess and prioritize risks. It evaluates each risk based on two factors: how likely it is to happen and how serious its impact would be. These two factors are plotted on a grid, with probability on one axis and impact on the other. Each risk is placed in a cell, which helps you see its overall severity.
High-probability, high-impact risks fall in the critical zone and require immediate action. Low-probability, low-impact risks require less attention. This visual approach helps teams focus on the most important risks and plan effective responses.
Understanding Probability and Impact
Before you build your matrix, you need to understand what each axis measures. Probability is the likelihood that a risk event will occur. It can be expressed as percentages (e.g., 10% chance) or as categories (low, medium, or high). Impact describes the consequences if the risk occurs. You measure impact in terms of schedule delays, cost overruns, quality issues, or other project objectives. Combining the two helps you see which risks are both likely and harmful.
You can choose a cardinal scale (numbers such as 1 through 5) or an ordinal scale (labels such as very low, low, medium, high, and very high). Cardinal scales allow for more granular scoring, while ordinal scales are simple and easy to communicate. Some organizations combine both by using numbers and colors (e.g., 1 – 10 with red, amber, and green zones). Select the approach that suits your project size, culture, and stakeholder preferences.
Steps to Build a Probability and Impact Matrix
- Define the scales in your risk management plan. Decide how many levels you need (e.g., five for probability and five for impact) and what each level means. For example, a probability of 1 might equal “less than 10% chance,” while a 5 might equal “greater than 80% chance.”
- Identify risks through brainstorming. Gather your team and subject-matter experts to generate a list of possible threats and opportunities. A structured brainstorming session helps you capture diverse viewpoints.
- Assign probability and impact scores. For each risk, discuss how likely it is to occur and how serious the consequences would be. Use the definitions you agreed on earlier. Recording these ratings in a table prevents misunderstanding later.
- Plot risks on the matrix. Place each risk in the cell corresponding to its probability and impact scores. Visualizing them makes it easy to see which ones land in the red zone (high priority) versus the green zone (low priority).
- Prioritize responses. High-priority risks require immediate action, so develop strategies such as avoidance, mitigation, transfer, acceptance, or escalation. Lower-priority risks are added to a watchlist in the risk register so you can monitor them periodically.
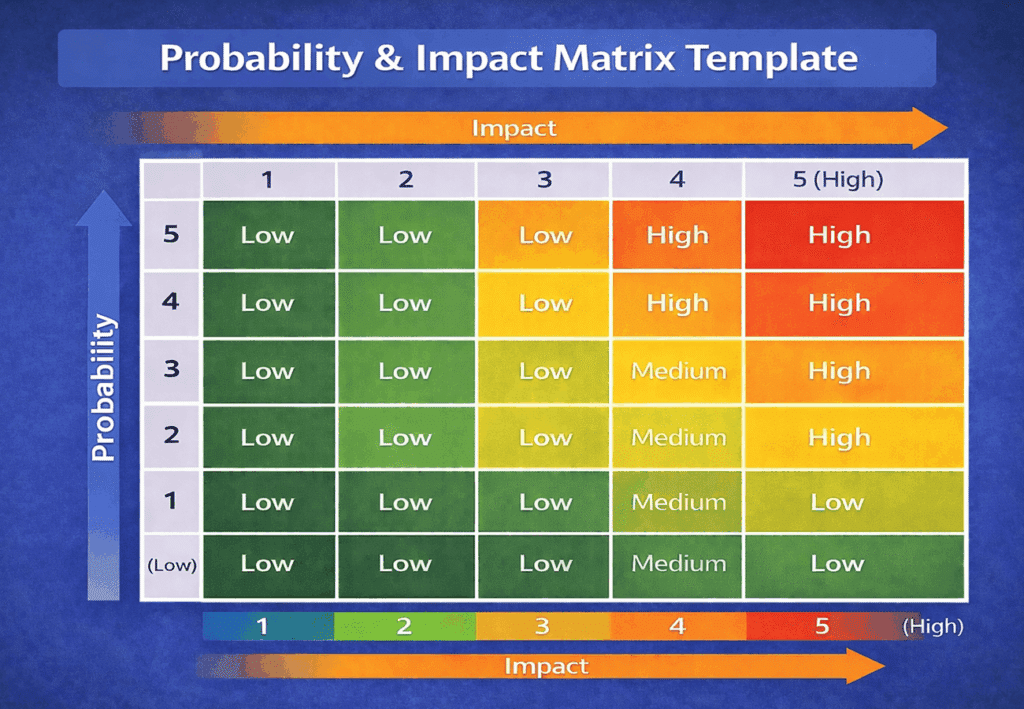
Probability and Impact Matrix Template
The following infographic shows a generic template for a probability and impact matrix that you can customize for your project:
Types of Probability and Impact Matrix
The matrix itself can be formatted in different ways depending on the scales you choose and the number of categories.
The following are the main variations:
- 3×3 matrix: This small matrix has three levels of probability and three levels of impact (low, medium, and high). It suits small projects or organizations that want a quick overview.
- 5×5 matrix: This matrix, commonly used for more complex projects, uses five levels on each axis. It provides finer distinctions between risks but requires more careful scoring.
Color-coded matrix: Many teams use either 3×3 or 5×5 grids, with colors such as green for low risk, yellow for medium, and red for high risk. Colors help stakeholders understand the severity at a glance.
An Example of Probability and Impact Matrix
Consider an example using a probability and impact matrix for a construction project with a cardinal scale ranging from 1 to 5 (1 being low and 5 being high) for both probability and impact:
Risk: Material Shortages
| Probability / Impact | 1 (Low) | 2 | 3 | 4 | 5 (High) |
| 1 (Low) | Low probability of material shortages; minimal impact on project schedule. | Limited chance of shortages; minor impact on project timeline. | Rare instances of shortages; slight delays possible. | Occasional shortages; moderate impact on schedule. | Significant likelihood of shortages and critical delays across multiple phases. |
| 2 | Unlikely but possible material shortages; minimal impact expected. | Low probability of shortages; minor delays in specific project phases. | Moderate chance of shortages; potential for noticeable schedule impacts. | Some likelihood of shortages; moderate delays in multiple project phases. | Highly improbable; minimal impact on project schedule. |
| 3 | Rare but possible material shortages; minimal delays expected. | Limited chance of shortages; sporadic delays in specific project aspects. | Moderate probability of shortages; noticeable delays in critical project phases. | Increased likelihood of shortages; significant schedule impacts. | Highly unlikely; minimal impact on project schedule. |
| 4 | Uncommon but potential material shortages; minimal schedule delays. | Unlikely shortages; occasional delays in various project phases. | Elevated chance of shortages; substantial impact on project timeline. | Significant likelihood of shortages; critical delays in multiple phases. | Rare; minimal impact on project schedule. |
| 5 (High) | Highly improbable material shortages; no impact on project schedule. | Highly unlikely shortages; negligible impact on project timeline. | Extremely rare material shortages; minimal effect on schedule. | Very rare but severe material shortages; critical delays in the project. | Almost impossible; no impact on project schedule. |
Benefits of Using a Probability and Impact Matrix
- Clarity and focus: The matrix provides a clear view of all risks in one place. You can quickly identify which risks need attention and communicate priorities to stakeholders with ease.
- Efficient resource allocation: It helps you direct time, budget, and effort toward high-priority risks. This reduces waste and prevents unnecessary spending on minor issues.
- Flexibility and scalability: The matrix works for both small and large projects. You can adjust the number of levels or expand the grid as your project grows and becomes more complex.
- Supports continuous improvement: By tracking risks and outcomes, you learn what works. This helps refine your approach and improves future risk assessments.
- Alignment with strategy: When used with enterprise risk frameworks, the matrix links project risks with business goals and helps guide better strategic decisions.
Limitations of a Probability and Impact Matrix
- Subjective ratings: Risk scoring depends on judgment, so different people may rate the same risk differently. This can lead to inconsistency.
- Limited detail: The matrix does not show the exact cost or schedule impact. It only gives a general idea of risk severity.
- Oversimplification: Complex risks may not fit neatly into simple categories, reducing accuracy.
- Static snapshot: The matrix reflects risks at a specific time. If not updated regularly, it can become outdated.
- May miss hidden risks: If risks are not identified early, they will not appear in the matrix and can be overlooked.
- Needs additional analysis: For critical risks, you must use advanced methods such as expected monetary value analysis or simulations to gain deeper insights.
Tips for Effective Use
- Integrate with your project timeline. When creating your project timeline, link major milestones to your risk matrix. High-impact risks should be addressed before critical milestones to prevent schedule slips.
- Engage stakeholders early. Share the matrix with sponsors and team members. Invite them to challenge assumptions and propose additional risks. This engagement builds support and surfaces hidden issues.
- Automate scoring where possible. As the PwC survey noted, risk leaders are investing in automation. You can use spreadsheet templates or risk management software to calculate scores automatically, generate heat maps, and integrate data from your risk register. Automation saves time and reduces manual errors.
- Review regularly. Set a recurring meeting to update the matrix after major changes, such as a design shift or the discovery of new information. By keeping it current, you avoid being blindsided by emerging threats.
FAQs
Q1. When should I create a probability and impact matrix?
Start during project planning, after risks are identified. Update it whenever new risks emerge or when you move into a new project phase.
Q2. Can I change the scales during a project?
Yes. As you gain more information, you may refine your definitions. Just document the changes and communicate them to the team.
Q3. Should opportunities be included?
Absolutely. A matrix can rank positive risks (opportunities) using the same scales. High-probability, high-impact opportunities deserve proactive pursuit.
Q4. How does the matrix relate to a risk register?
The matrix helps prioritize risks. The risk register stores all details, including owners, response plans, and status updates. Use both tools together for effective risk management.
Summary
A probability and impact matrix helps you assess risks quickly and focus on what matters most. By combining likelihood and impact, you can prioritize actions and avoid surprises. This tool improves decision-making, saves time, and keeps your project on track. When you use it consistently, you gain better control over uncertainty. In today’s complex projects, a simple matrix can make a big difference in achieving successful outcomes and meeting your goals.

I am Mohammad Fahad Usmani, B.E. PMP, PMI-RMP. I have been blogging on project management topics since 2011. To date, thousands of professionals have passed the PMP exam using my resources.