Many managers use the words “dashboard” and “Balanced Scorecard” interchangeably, yet they serve very different purposes. A dashboard gives you a snapshot of what is happening right now. A Balanced Scorecard helps you translate long-term strategy into measurable objectives.
If you’ve ever wondered which tool suits your needs or whether you need both, this blog post will answer those questions. We’ll explore how dashboards and Balanced Scorecards differ, how they complement each other, and how you can decide which approach to use.
Let’s get started.
What is a Dashboard?
A dashboard is a performance monitoring tool. It displays key metrics in real time using charts, gauges, or graphs. Imagine driving your car: the speedometer, fuel gauge, and temperature indicator tell you whether everything is working within safe ranges. A business dashboard functions the same way. It consolidates metrics, alerts you when a value crosses a threshold, and helps you react quickly.
Dashboards focus on short-term, operational goals. They measure metrics, which are simple numerical values without a target. Some dashboards include targets or thresholds, but the emphasis is on showing the current state. Because dashboards are updated automatically, they are ideal for daily or real-time monitoring in customer service, sales, or production.
What is a Balanced Scorecard?
A Balanced Scorecard (BSC) is a strategic management framework. It links organizational objectives to key performance indicators (KPIs), targets, and initiatives. Kaplan and Norton introduced the BSC in the early 1990s to help organizations balance financial and non-financial measures. Today, the BSC is widely used across the private and public sectors; more than half of major companies in the U.S., Europe, and Asia use it.
Balanced Scorecards are updated periodically, often monthly or quarterly, because they track progress toward long-term goals. They include a strategy map that shows cause-and-effect relationships between objectives. This helps teams understand how actions in one area, such as employee training, affect outcomes in another, such as customer satisfaction or financial performance.
Dashboard Vs Balanced Scorecard: A Side-by-Side Comparison
The table below summarizes the major differences between dashboards and Balanced Scorecards. Note that the tools complement rather than replace one another.
| Feature | Dashboard | Balanced Scorecard |
| Purpose | Monitor performance in real time and provide a high-level view of current operations. | Translate strategy into measurable objectives and monitor progress toward long-term goals. |
| Measurement | Uses metrics (numbers without targets) or synthetic benchmarks. | Uses KPIs (metrics with explicit targets and thresholds). |
| Link to objectives | Often not linked directly to strategic objectives. | Each KPI is aligned with an objective on the strategy map. |
| Update frequency | Real-time or daily. | Periodic (monthly or quarterly). |
In short, dashboards tell you what is happening right now, while Balanced Scorecards explain why and provide guidance on how to respond. Both tools are valuable when used appropriately.
Visual Comparison
The infographic below provides a visual summary of the differences discussed above. It uses contrasting colors to separate the two columns and small icons to illustrate each category.

How Dashboards and Balanced Scorecards Are Designed
The design processes differ significantly. A dashboard design starts at the bottom. Teams identify the metrics to monitor, then build a visual interface to display them and update it automatically. Because dashboards operate at an operational level, they rarely require deep strategic analysis.
Balanced Scorecards follow a top-down design. The leadership team begins by defining strategic objectives. These objectives are mapped on a strategy map to show cause-and-effect relationships. KPIs are then chosen to measure progress toward each objective, with specific targets and thresholds. Finally, initiatives or action plans are defined to drive improvement.
Usage Processes: Tactical Vs Strategic
Once implemented, dashboards and Balanced Scorecards are used differently.
Dashboard usage: the business system generates events—for example, a new customer service ticket or a production cycle. The dashboard displays the relevant metric values. If a value falls outside the normal range, it triggers a notification. The responsible manager reviews the alert, investigates the cause, and takes action. Dashboards facilitate rapid responses to operational issues.
Balanced Scorecard usage: A responsible employee follows the objectives on the strategy map. They execute the action plan aligned with each objective and report KPIs periodically. The Balanced Scorecard compares actual results against targets and visualizes progress on the strategy map. When performance lags, teams analyze cause-and-effect relationships, update initiatives, and adjust the plan. This process supports continuous improvement and strategic alignment.
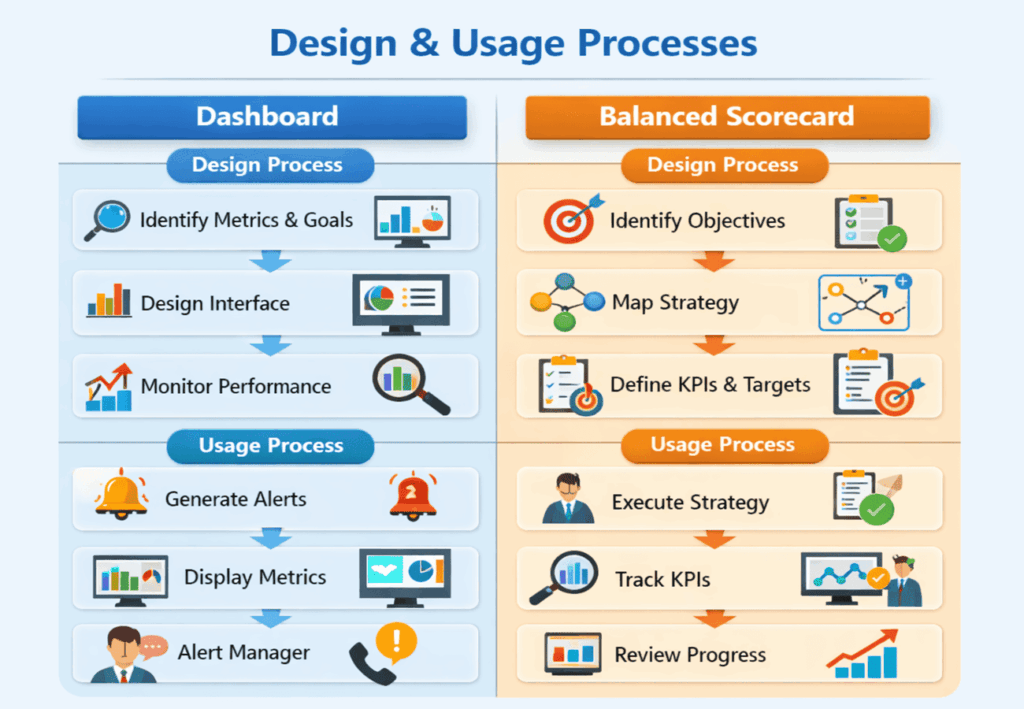
Process Visualization
The following infographic illustrates these design and usage processes. It shows two parallel flows for dashboards and Balanced Scorecards, making it easy to see where they diverge and where they overlap.
Common Features and Overlaps
Although dashboards and Balanced Scorecards serve different purposes, they share some common features:
- Visual communication: both tools rely on charts and diagrams to present information clearly.
- Data-driven insights: they encourage organizations to collect and analyze data rather than rely on intuition.
- Support for decision-making: dashboards prompt immediate action, while Balanced Scorecards guide strategic decisions.
One area where the tools overlap is in how they treat measures and KPIs. Many organizations use synthetic targets in dashboards to simulate KPIs. While this can provide quick context, it does not replace the strategic alignment offered by a Balanced Scorecard. The key is to recognize which tool is being used and why.
Example: Customer Service
Consider a customer service department at a mid-sized company. The team uses a dashboard to monitor call volume, average wait time, and resolution rate. If the average wait time exceeds the acceptable range, the dashboard alerts the supervisor, who may add an agent or adjust priorities.
At the same time, the company’s Balanced Scorecard includes a strategic objective to “Enhance customer satisfaction.” The associated KPI is Net Promoter Score (NPS) with a target of 50. The Balanced Scorecard shows that improving agent training drives higher NPS and higher revenue. By linking this objective to training initiatives and customer feedback surveys, the company can see how daily improvements translate into long-term results.
Dashboards and Balanced Scorecards work together in this example. The dashboard ensures daily operations run smoothly, while the Balanced Scorecard aligns operational improvements with strategic goals.
When Should You Use Each Tool?
Use a dashboard when you need real-time or daily visibility into operational performance. Dashboards are ideal for call centers, supply chain management, website analytics, production lines, or any process that requires rapid responses. They work best when metrics are straightforward and do not need deep strategic interpretation.
Use a Balanced Scorecard to align the organization around strategic goals. The BSC is suitable for annual planning, strategy execution, organizational alignment, and performance evaluation. It helps you align objectives across the four perspectives (financial, customer, internal processes, and learning and growth) and ensures thatactions support long-term success. Use a BSC when you want to understand “why” behind results and adjust plans accordingly.
Use both together when you need to bridge daily operations with long-term strategy. A dashboard can feed data into a Balanced Scorecard. For example, daily sales figures from the dashboard help inform revenue KPIs on the BSC. This integration provides a complete picture—from immediate performance to strategic outcomes.
Tips for Implementing Dashboards and Balanced Scorecards
- Start with clear objectives. Before building a dashboard or a Balanced Scorecard, define what you want to achieve. Ask yourself, “What question do I need to answer?”
- Choose meaningful metrics. Avoid vanity metrics that don’t influence decision-making. Select measures that reflect performance drivers and align with objectives.
- Keep it simple. Whether designing a dashboard or a Balanced Scorecard, resist the urge to track everything. Focus on the most important metrics and KPIs.
- Update regularly. Dashboards require real-time data feeds; Balanced Scorecards need periodic updates. Set a cadence and assign owners to ensure data quality.
- Communicate and train. Share dashboards and scorecards with relevant teams. Provide training to help people interpret the data and act on it.
FAQs
Q1. What is the main difference between a dashboard and a Balanced Scorecard?
A dashboard shows current performance metrics, while a Balanced Scorecard links KPIs to strategic objectives and tracks progress toward long-term goals.
Q2. Can a dashboard replace a Balanced Scorecard?
No. Dashboards provide operational insight but lack the strategic alignment a Balanced Scorecard offers. Many organizations use both tools together.
Q3. How often should I update my Balanced Scorecard?
Most companies review their Balanced Scorecard monthly or quarterly. The update frequency depends on the pace of your strategy and the availability of reliable data.
Q4. Do dashboards need targets?
Dashboards often display metrics without targets, but adding thresholds or ranges can make them more actionable. However, targets alone do not turn a dashboard into a Balanced Scorecard.
Q5. Is the Balanced Scorecard still relevant in the age of AI and big data?
Yes. While data analytics tools provide new insights, organizations still need a framework to link data to strategy. The Balanced Scorecard helps translate insights into actions and align teams around common goals.
Summary
Understanding the differences between dashboards and Balanced Scorecards empowers you to choose the right tool for each situation. Dashboards answer the question “What is happening now?”, while Balanced Scorecards answer “Why is this happening and what should we do?” When used together, they create a powerful system for real-time monitoring and strategic planning. Incorporate these tools thoughtfully, keep your metrics simple and aligned, and watch your organization move from reactive firefighting to proactive strategy execution.

I am Mohammad Fahad Usmani, B.E. PMP, PMI-RMP. I have been blogging on project management topics since 2011. To date, thousands of professionals have passed the PMP exam using my resources.