When you invest in a project, you want to know when you will get your money back. A simple payback period tells you when cash inflows equal the initial cost. But it ignores the fact that money today is worth more than money tomorrow. This leads to misguided decisions. To fix that problem, you use the discounted payback period. It adjusts each cash flow for the time value of money so you can see when the present value of cash inflows finally covers the investment.
Have you ever wondered how long it really takes to recover your investment, accounting for inflation and opportunity cost?
In this blog post, you will learn what the discounted payback period is, how it differs from the simple payback period, how to calculate it, and how to interpret the results.
Let’s get started.
What is the Discounted Payback Period?
The discounted payback period (DPP) is the number of years it takes to break even on a project when cash flows are discounted for the time value of money. DPP is calculated by discounting future cash flows and measuring when their cumulative present value equals the original investment. This makes the metric more precise than the standard payback period because it recognizes that a dollar received today is worth more than a dollar received later.
Like the standard payback period, DPP is widely used in capital budgeting to evaluate project feasibility. Management compares several potential projects and wants to know which one recovers the initial cost sooner.
The discounted version answers that question while accounting for the discount rate. A shorter discounted payback period means the project generates cash flows quickly and reduces risk.
Why Discount Cash Flows?
Money has a time value because of inflation, investment opportunities, and risk. If you receive $1,000 next year, it is not worth as much as $1,000 today. To account for this, finance professionals apply a discount rate to future cash flows. The discount rate often reflects the company’s cost of capital or expected return.
Recent research shows that firms tend to use sticky discount rates that are, on average, three percentage points above their cost of capital. Over time, the gap between firms’ discount rates and their cost of capital has grown—from about 3% in 2002 to 5% in 2020. This gap matters because it influences project selection. By discounting cash flows at an appropriate rate, you ensure your analysis reflects economic reality.
Discounted Payback Period Vs Simple Payback Period
Both metrics estimate how long it takes to recoup the initial investment, but they differ in method and interpretation:
- Time value of money – The discounted payback period discounts each cash flow using a chosen rate, while the simple payback period uses nominal cash flows. Because of discounting, cash received later is worth less.
- Accuracy – The discounted version is more accurate for long-term or uneven cash flows. It prevents early-year cash flows from masking later losses.
- Decision implications – When comparing two projects, the one with the shorter discounted payback period is generally preferred, but you should also consider other metrics, such as net present value (NPV) and internal rate of return (IRR). A project may have a longer DPP yet still add value after payback.
Example: Comparing Simple and Discounted Payback Periods
Suppose a company invests $5,000 in a project and expects annual inflows of $2,000, $4,500, $4,500, $3,000 and $3,000 over the next five years. If we ignore discounting, the cumulative nominal cash flow turns positive between years 2 and 3, giving a simple payback period of a little more than two years.
When we apply a 12% discount rate, the discounted cash flows are smaller, and the cumulative present value becomes positive only in year 6. The discounted payback period in this case is approximately 5.07 years, as shown in the example below.
How to Calculate the Discounted Payback Period
The formula for calculating the discounted payback period is straightforward:
DPP = y + |n| / p
where:
y = the period before the cumulative discounted cash flow becomes positive
n = the cumulative discounted cash flow in period y (a negative number)
p = the discounted cash flow in the period when the cumulative total turns positive
To apply this formula, follow these steps:
- Estimate net cash flows for each year of the project, including both inflows and outflows.
- Select a discount rate based on the cost of capital, market interest rate, or desired rate of return.
- Discount each cash flow using the present value formula: Discounted Cash Flow = Net Cash Flow / (1 + r)^t, where r is the discount rate, and t is the year.
- Compute the cumulative discounted cash flow by adding each period’s discounted cash flow to the running total.
- Identify the year just before the cumulative total turns positive (y) and the period when it becomes positive (p). Then insert these values into the formula.
Calculating DPP with a Table
Let’s revisit the example introduced earlier. The company invests $5,000 (outflow) and forecasts inflows of $2,000, $4,500, $4,500, $3,000 and $3,000 in years 1–5. At a 12% discount rate, the discounted cash flows and cumulative totals look like this:
| Year | Net Cash Flow (USD) | Discounted Cash Flow at 12% (USD) | Cumulative Discounted Cash Flow (USD) |
| 0 | –5,000 | –5,000 | –5,000 |
| 1 | –5,000 | –4,464 | –9,464 |
| 2 | 2,000 | 1,594 | –7,870 |
| 3 | 4,500 | 3,203 | –4,667 |
| 4 | 4,500 | 2,860 | –1,807 |
| 5 | 3,000 | 1,702 | –105 |
| 6 | 3,000 | 1,520 | 1,415 |
In this table, the cumulative discounted total turns positive in year 6. The year preceding the positive total is year 5, where the cumulative total is –$105 (y = 5 and n = –105). The discounted cash flow in year 6 is $1,520 (p = 1,520). Plugging these values into the formula gives:
DPP = 5 + |–105| / 1,520 = 5.07 years
This means it takes just over five years, in present-value terms, for the project to pay back the initial investment.
Visualizing the Discounted Payback Period
Understanding DPP is easier with visuals. The infographic below shows how discounted cash flows accumulate over time and where the DPP occurs.

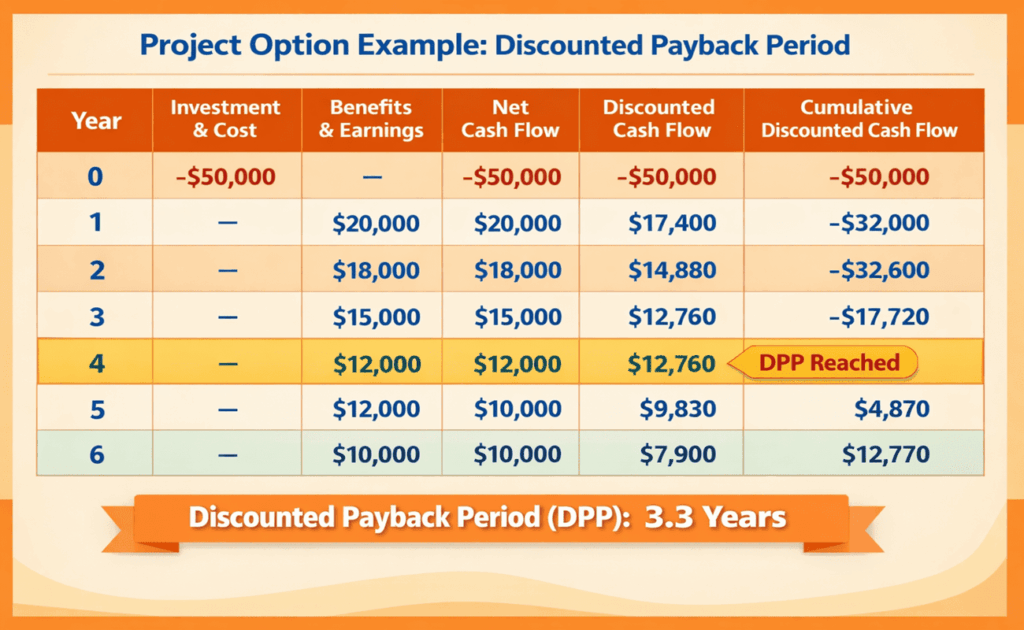
Example Chart
Our second infographic summarizes the project example with a tabular layout. It highlights the negative initial investment, annual inflows, discounted cash flows, and cumulative totals. The callout shows where the cumulative present value crosses zero and how to compute the DPP.
Practical Applications of DPP and Insights
The discounted payback period is most useful for projects with significant year-to-year cash flow variability or long-term cash flows that are uncertain. Because it accounts for the time value of money, it can improve decision-making compared with the simple payback period.
However, DPP should not be the only measure you use. It ignores cash flows beyond the payback point, so it does not capture a project’s full profitability. You should complement it with metrics like net present value or internal rate of return to get a complete picture.
Researchers have also cautioned that firms’ discount rates may not reflect the true costs of capital. On average, firms’ discount rates are 3 percentage points higher than their cost of capital, and they adjust these rates infrequently. As a result, investment decisions may be overly conservative. Between 2002 and 2020, the average gap between firms’ discount rates and their perceived cost of capital widened from 3% to 5%, contributing to underinvestment. Understanding this behavior helps managers select appropriate discount rates and avoid missing profitable opportunities.
FAQs
Q1. What discount rate should I use?
A common starting point is your company’s weighted average cost of capital (WACC) or the rate of return you expect from similar investments. Some firms also consider market interest rates or risk-adjusted return targets. Remember that discount rates often differ from perceived costs of capital, so revisit them regularly.
Q2. Does a shorter discounted payback period always mean a better project?
Not necessarily. A project with a long DPP might yield large cash flows after the payback period, thereby increasing the net present value. Use DPP alongside metrics like NPV and IRR to make balanced decisions.
Q3. How is the discounted payback period used in practice?
Organizations use DPP to quickly screen projects and gauge risk. It is especially helpful when capital is limited or when comparing options with similar total returns but different cash flow timing. You can also use DPP to evaluate past investments and see how long they actually took to pay back.
Summary
The discounted payback period gives a clearer view of when an investment truly recovers its cost. It adjusts cash flows for time and risk, which improves decision quality. This method works best when you compare projects with similar lifespans. It should never stand alone. Pair it with NPV, IRR, and ROI for balance. When used correctly, the discounted payback period helps reduce risk, improve capital allocation, and support smarter project selection.
Further Reading:

I am Mohammad Fahad Usmani, B.E. PMP, PMI-RMP. I have been blogging on project management topics since 2011. To date, thousands of professionals have passed the PMP exam using my resources.