The seven basic quality tools are a collection of quality tools to help quality professionals improve the quality of products or processes.
Quality is a common term in all industries, including project management, operational management, business management, production, and customer service. It gained momentum when Toyota Corp moved up the growth ladder by following quality standards. Over time, quality became synonymous with Toyota.
You can define quality in many ways; a few definitions are as follows:
Joseph Juran defined quality as “fitness for purpose.”
Edward Deming defined it as “meeting or exceeding customer expectations.”
Crosby defined quality as “conformance to requirements.”
In summary, the quality is about:
- Understanding customer requirements.
- Designing to meet that need.
- Developing processes that can create that design.
- Controlling to ensure the output continually meets the design.
To understand quality, a consultancy in the USA surveyed 86 managers, and the understanding of managers of quality is as follows:
- Perfection
- Consistency
- Eliminating waste
- Speed of delivery
- Compliance with policies and procedures
- Providing a good, usable product
- Doing it right the first time
- Delighting or pleasing customers
- Total customer service and satisfaction
Every industry has different parameters to measure quality. For example, in manufacturing, you can study quality using the following indices:
- Performance
- Features
- Reliability
- Conformance
- Durability
- Serviceability
- Aesthetics
- Perceived quality
In the service industries, in hotels, airlines, hospitals, government agencies, etc., the quality parameters are:
- Timeliness
- Courtesy
- Consistency
- Accessibility and convenience
- Accuracy
- Responsiveness
Quality is about fitness for use and meeting or exceeding customer requirements.
Many professionals often confuse quality with grade. Quality and grade are different; quality deals with conformance to requirements, while grade refers to features and functionalities.
A smartwatch can be a high-grade product with several advanced features, such as heart rate monitors, pedometers, blood pressure monitors, and sleep monitors. However, if the smartwatch performs below expectations, for example, giving incorrect blood pressure readings, the sleep timer not always working, etc., the product is said to have a high grade but low quality.
However, if a cheap watch with no advanced features performs exceptionally well, it is a low-grade product but of high quality.
In project management, quality is one of the six constraints; the others are schedule, budget, scope, risk, and resource.
I hope now you have a better understanding of quality. Now, let’s discuss the seven quality tools.
What are the Seven Basic Quality Tools?
The seven basic tools of quality are:
- Histogram
- Control Chart
- Pareto Diagram
- Fishbone Diagram
- Check Sheet
- Flowchart
- Scatter Diagram
1. Histogram
A histogram diagram shows the frequency distribution. It shows the history or trend of a variable.
The variables can be defects, warranties, scraps, reworks, response time, etc. Deviation in a variable such as timeliness and accuracy can be represented graphically using a histogram.
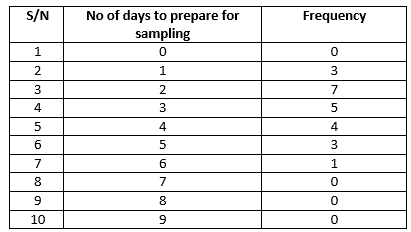
The variations are also called observation or frequency, and they are plotted on the vertical axis while the parameter is on the horizontal axis. For example, crude sampling requires days of preparation, but if you want to see the distribution, you can use historical data in the form of a histogram.
Drawing Histograms is easy. Divide the entire range into equal intervals (bins). The frequency of the bin is plotted on the vertical axis and the interval on the horizontal.

Uses of a Histogram
- It provides a quick view of variation within a process.
- It provides parameters with the highest frequency and maximum probability.
- Helps to organize large data sets into a graph.
- It is a good presentation tool.
Pros
- It is easy to draw.
- It can be used to make a presentation to stakeholders.
- It enhances quick decision-making.
- It helps identify the level of deviation.
- It shows the ranking of the cause of the defect.
Cons
- It is difficult to compare two datasets.
- It can only be used for continuous, not discrete data.
2. Pareto Chart
A Pareto chart is a histogram that categorizes the observation and identifies the “vital few.” The word vital few becomes necessary as they have the maximum impact on the solution.
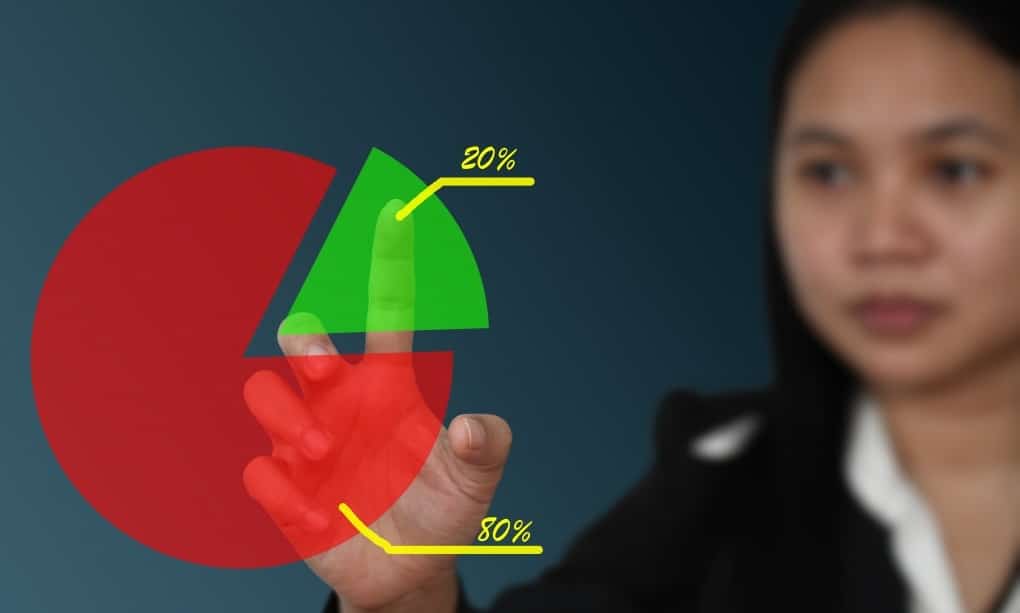
All projects have issues, and a project manager cannot spend time-solving all those issues. So, they prioritize the vital few causes that are affecting the project most. After prioritizing issues, solving 20% of root causes eliminates 80% of problems. This phenomenon is known as the Pareto rule.
A Pareto chart is a key tool in quality management and Six Sigma. It is a vertical bar graph that shows problems or opportunities in a prioritized order. The categories from the left of the graph include mutually exclusive items arranged in decreasing order.
The Pareto chart helps you segregate the problems and find their root causes. Then, you can invest your effort in those causes and solve most of the problems.
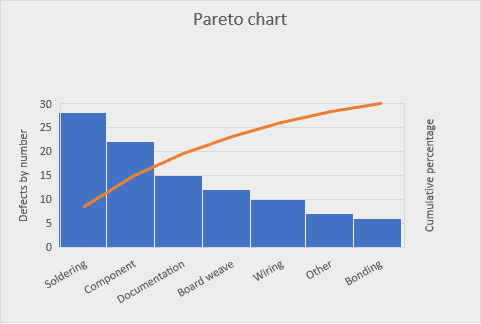
To draw the Pareto chart, you collect the problems in your process, categorize them by their type, and draw a bar chart per their category. The most frequently occurring problems will be on the left and the least on the right side.
We will use a case study of spacecraft manufacturing to draw a Pareto chart. Assuming regulatory standards have been followed, we will study defects in a spacecraft’s printed circuit board.
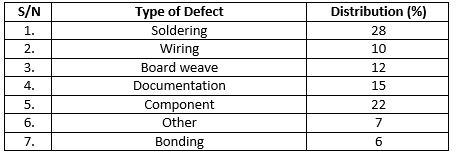
The Pareto chart for the distribution is shown below:
Benefits of a Pareto Chart
- It helps you focus on solving the few causes generating the most problems.
- It helps you visualize problems.
- It is an excellent visual communication tool.
Pros
- Ideal for prioritizing discrete data.
- Quite easy to draw.
- Enhances quick decision-making.
- Helps focus attention on critical issues.
Cons
- It does not show the root cause of the problem.
- The Pareto principle is a rule of thumb and does not apply to all situations.
- It shows the frequency, not the severity.
Read the Pareto Chart in detail.
3. Root Cause Analysis
This is also called the Ishikawa diagram, named after the Japanese Organizational Theorist, Kaoru Ishikawa. It is a visual tool to find the root causes of an issue. A root cause analysis diagram is shown below:
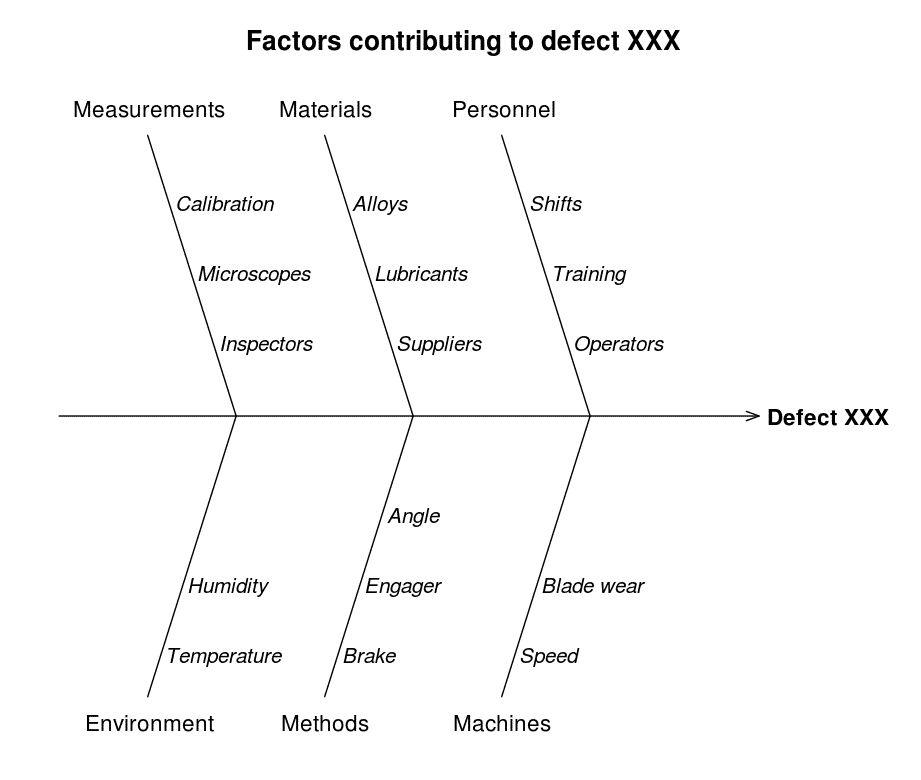
Root Cause Analysis (RCA) is a systematic process used to identify the underlying causes of problems or incidents within a system. It helps determine what, how, and why an issue occurred, rather than simply addressing its symptoms.
The process typically involves several steps. First, you define the problem and asses its impact. Then, you collect relevant data and analyze it to understand the sequence of events leading to the problem. Next, you identify the potential causes using techniques such as the “5 Whys” method or fishbone diagrams.
After identifying potential causes, you will evaluate them to determine which are most likely to have contributed to the problem. Finally, you will develop corrective actions and implement them to address the root causes and prevent recurrence of the issue.
RCA is widely used in many industries including project management, healthcare, manufacturing, and aviation, to improve quality, safety, and efficiency.
Pros
- Creative thinking and ideas are involved in its development
- Useful for both forward (quality planning) and backward (quality control) studies
- The most useful tool for identifying the cause of a problem
- This opens opportunities for improvement
Cons
- It can become counterproductive if not well coordinated or facilitated
- It only addresses one problem per time; therefore you may need several brainstorming sessions for multiple problems
Read Root Cause Analysis in detail.
4. Check Sheet
A checksheet is also known as a checklist. This is a data collection sheet that facilitates data interpretation. Since it captures quantitative data in the form of attribute data, it is also known as a tally sheet.
The differences between attribute data and variable data are:
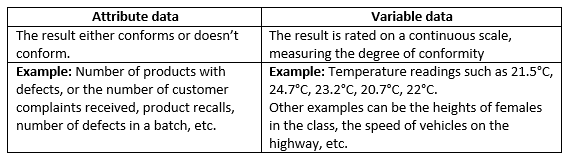
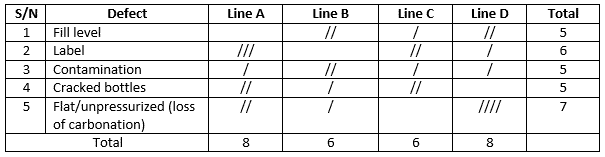
The Check Sheet helps facilitate data collection for further analysis. Consider the table below showing an inspection of a bottling company’s production line. The number or frequency of each defect is represented in the tally of slashes.
Pros
- Helps to organize data gathering
- The output can be used for a Pareto chart or a histogram
- Facilitates interpretation of data
- Can spur more ideas
Cons
- Doesn’t find out the root cause of an identified defect.
- Depends on the Pareto chart or histogram for data presentation.
5. Control Chart
A control chart is a graphical tool that helps you find out if the process is in control.
Changes occur in every process, but it becomes a cause of concern when they cross the set limits and the process is out of control.
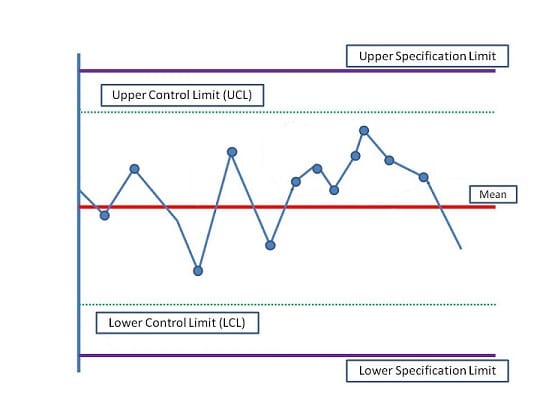
A control chart has two limits: control limits and specification limits.
Control limits are of two types:
Upper control limit (UCL): This is the maximum limit, and when the variable crosses it, you will initiate an investigation.
Lower control limit (LCL): This is the minimum point, and when the variable crosses it, you will initiate an investigation.
The project manager sets control limits. Like control limits, specification limits are also of two types: upper and lower specification limits. The customer defines specification limits.
When the variable is beyond the specification limit in either direction, you can say that the product is defective and must find the defect’s cause.
Control limits are always stricter than the customer’s specification limits. Hence you can say that specification limits are always outside UCL and LCL.
Upper and lower control limits are based on standard statistical calculations used to establish the natural capability of a process. The quality team has to set the range between the upper and lower control limits. Usually, the limit is set to +/- 3? (3-sigma) quality standard.
Note that
1 Sigma = 68.26%
2 Sigma = 95.46%
3 Sigma = 99.73%
6 Sigma = 99.99%
A sigma represents the quality standard. 6-sigma is the highest quality standard and has been adopted by companies such as Motorola, Bank of America, General Electric, Airlines, and JP Morgan Chase., to reduce waste and improve customer satisfaction and efficiency.
The Rule of Seven: When seven data points are observed on one side of the mean, there is cause for investigation, as the process may be out of control. The control chart below shows this.
A cause can be a special cause or a common cause. A special cause is a usual occurrence and requires investigation, whereas a common cause is a normal change and is most likely to be within the tolerable limit.
A rule of seven is an example of a special cause.
Pros
- Useful for monitoring a process
- Can show the real-time behavior of a process
- Saves the cost of rework and system failure
- It can be programmed and automated
- Helps to meet customer specifications
Cons
- Does not display the root cause(s) of a deviation
- Requires a level of technical expertise for use
- Tendency to mistake common cause for a special cause and vice versa
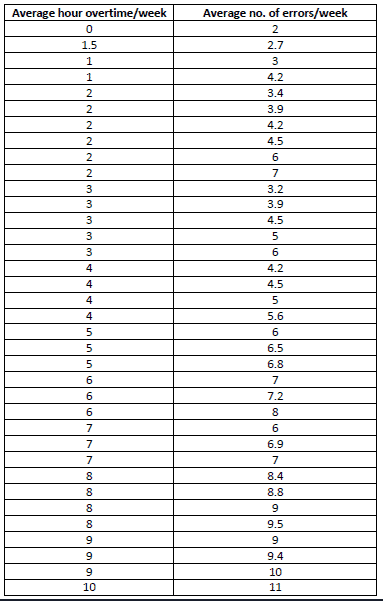
6. Scatter Diagram
A Scatter diagram shows you the relationship between two variables. The first variable is independent, while the other is the dependent variable.
A scatter diagram helps you study the correlation between two variables. For example, suppose the number of errors in a product batch could be related to the number of hours of overtime by personnel. In that case, the number of errors is the dependent variable, while the overtime hour is the independent variable.
The independent variable is plotted on the x-axis, while the dependent variable is on the y-axis.
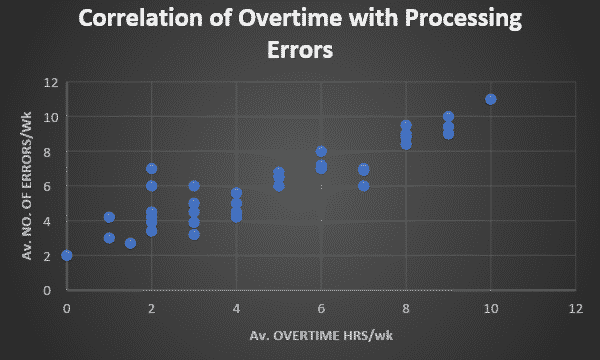
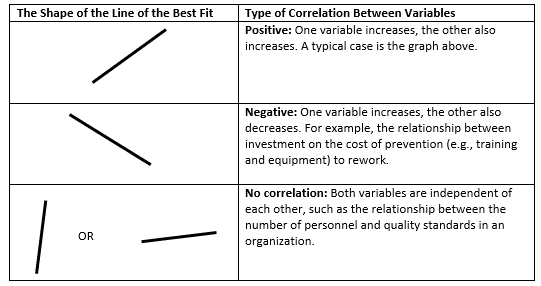
The line shown in the above image is known as the line of best fit. The line is drawn so that most data points crowd around it.
Pros
- It helps to establish the relationship between variables
- Can help in input vs. output simulations
- Useful for the cause-and-effect study
Cons
- Requires accurate and adequate data
Read more about the Scatter diagram.
Now we come to the last of the seven basic quality tools.
7. Flow Charts
Flow Charts show the various steps to help quality managers find bottlenecks and improve the process flow performance.
The shapes used to draw flow charts are as follows:
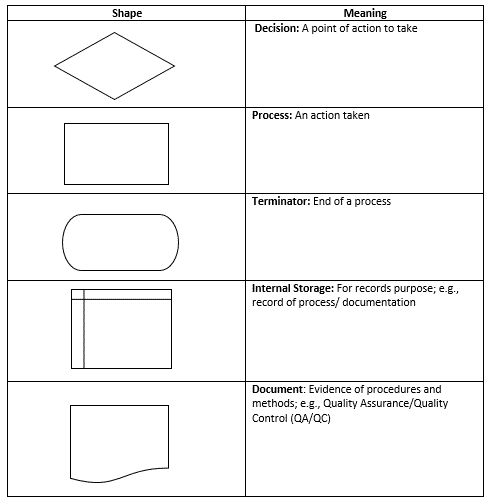
A typical flow chart for getting PMP certification is shown below.
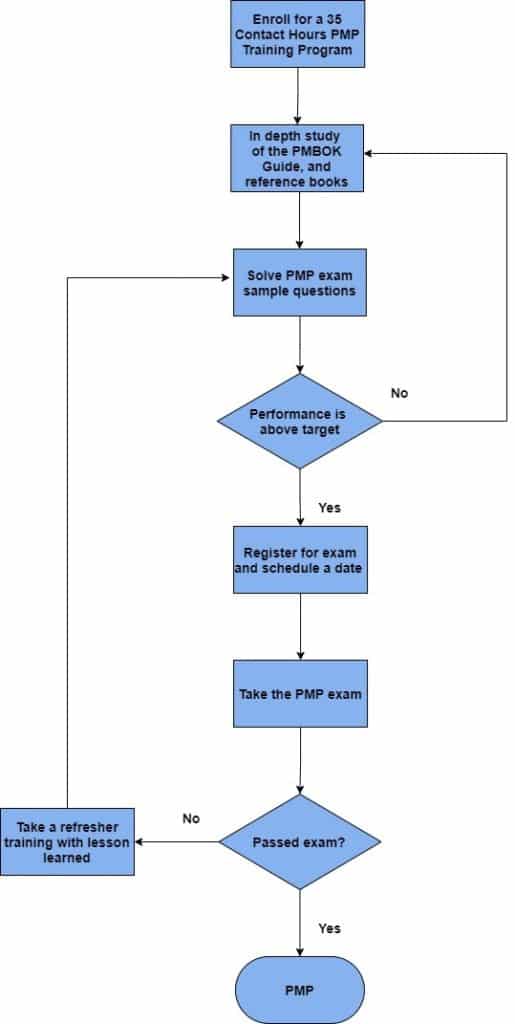
Once the flow chart is completed, you can review it to identify areas for improvement. This is where de-bottlenecking comes in. Standard Operating procedures most times require a flow chart to enable operators to understand the process flow.
It is applicable in computer programming and debugging of errors in a program.
Pros
- Can help in process improvements
- Useful for de-bottlenecking a process
- Useful during a quality audit
- Helps in problem-solving
- It can help discover and therefore prevent a potential problem
- It can be used to study the value chain of an entire process, e.g., SIPOC (Supplier, Input, Process, Output, Consumer) study
- Pictorial and effective for presentation
Cons
- It does not uncover underlying root causes
- It needs to be updated after the process review
Summary
The Seven Basic Quality Tools offer a systematic approach to identifying and solving problems in any process or product. By integrating these tools into quality management practices, businesses can enhance efficiency, reduce costs, and deliver greater value to customers. Embracing these foundational tools promotes a culture of continuous improvement, and ensures long-term success and customer satisfaction.

I am Mohammad Fahad Usmani, B.E. PMP, PMI-RMP. I have been blogging on project management topics since 2011. To date, thousands of professionals have passed the PMP exam using my resources.