Project managers often encounter stubborn problems that persist. Why does a deliverable keep falling behind schedule? Why does a product defect return despite repeated fixes? Getting to the root of these issues is essential for your team’s success and for passing the Project Management Professional (PMP) exam. One of the most effective tools for uncovering underlying causes is the cause-and-effect diagram, also known as the fishbone or Ishikawa diagram.
This blog post explains what fishbone diagrams are, how to build them, why they matter in modern project management, and how they are tested on the PMP exam. It also offers step-by-step instructions, real-world examples, and fresh data from recent studies.
Let’s get started.
Why Root Cause Analysis Matters in Modern Projects
Projects operate in complex environments. Changes in requirements, technology, or team dynamics can trigger unexpected issues. Fixing symptoms without addressing the underlying cause wastes time and resources. A fishbone diagram helps you visually map possible causes of a problem.
In a quality improvement study published in the Global Journal on Quality and Safety in Healthcare, researchers noted that fishbone diagrams help teams focus on root causes rather than symptoms and encourage structured brainstorming to narrow the scope of investigation.
They also noted that this visual tool narrows the scope of an investigation, making it more actionable, and builds a shared understanding among team members. Working through this process reduces the risk of repeating the same mistakes and leads to better project outcomes.
Root cause analysis is no longer confined to manufacturing. It appears across healthcare, education, software, and services. The PMP exam reflects this shift by asking candidates to understand quality tools in various contexts. That means knowing when to use a fishbone diagram on a predictive waterfall project and when it fits into an agile or hybrid environment.
What is a Fishbone Diagram in Project Management?
A fishbone diagram is a problem-solving tool shaped like the skeleton of a fish. It models possible root causes of a problem and helps teams brainstorm solutions. Because it resembles a fish, it goes by many names: cause-and-effect diagram, Ishikawa diagram, fishikawa diagram, or herringbone diagram. Dr. Kaoru Ishikawa introduced the tool in the 1960s to improve quality control in the Japanese industry. Whatever name you encounter on the PMP exam, remember that all refer to the same concept.
Fishbone diagrams are used across disciplines. They support root cause analysis in quality management, product development, healthcare, education, and even brainstorming sessions for students. The diagram encourages teams to consider all angles rather than jumping to the first solution. Integrating fishbone diagrams with the “Five Whys” technique—asking “why” repeatedly to peel back layers of causality—helps uncover more profound insights.
Step-by-Step Process to Draw a Fishbone Diagram
You can use the following step-by-step approach to create a Fishbone (Cause-and-Effect) diagram for your project.
Step 1: Identify the Problem (Effect)
Begin by clearly defining the problem you want to solve. The problem should be specific and clearly understood by everyone involved. Ensure all stakeholders agree on the issue before proceeding.
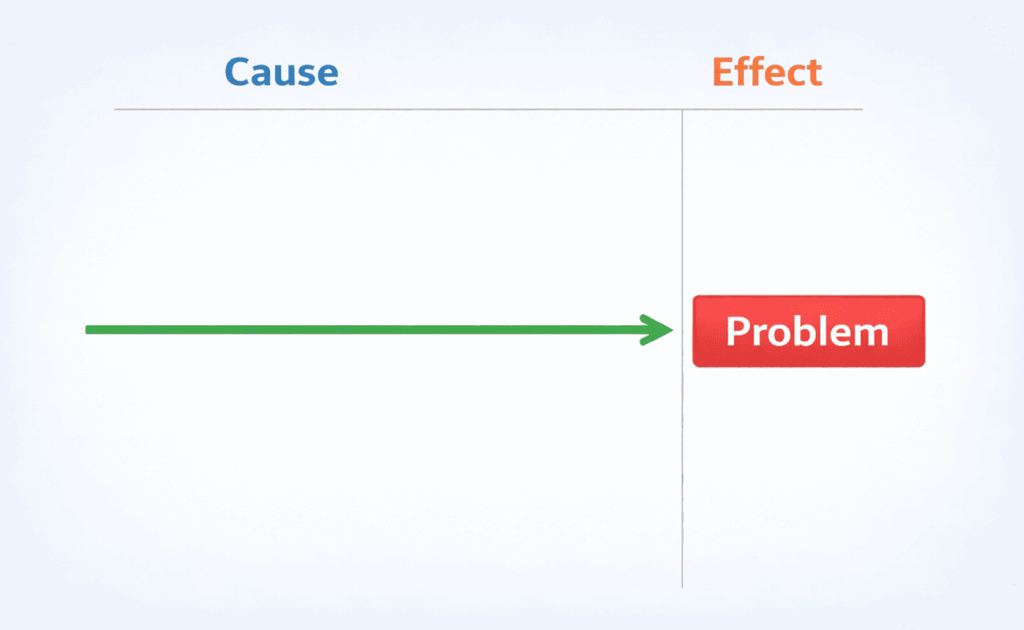
Write the problem statement and place it at the “head” of the fishbone diagram. This becomes the focal point of the analysis and guides the identification of possible causes. You can use brainstorming sessions or team discussions to help clearly define the problem.
Step 2: Identify and Categorize the Causes
Next, identify the major categories that may be contributing to the problem. These categories depend on the project or industry type, but common examples include people, processes, equipment, materials, and the environment.

Each category forms a main “bone” that branches from the diagram’s central spine. These main branches help organize your thinking and ensure all possible areas are considered.
Step 3: Brainstorm Possible Causes and Build the Diagram
Once the categories are in place, work with your team to brainstorm all possible causes under each category. Identify specific factors that could be contributing to the problem.
As you list these causes, draw smaller branches from each main category bone to represent them. For deeper analysis, ask questions such as, “Why does this happen?” Write down the answer, then ask “Why?” again. Continue adding sub-branches until the causes are sufficiently detailed.
This step is critical. Take your time to ensure the diagram captures all realistic and relevant causes.
This approach closely aligns with the “5 Whys” technique, which encourages repeatedly asking “Why?” to uncover the true root cause of a problem.
Step 4: Analyze the Diagram
After completing the diagram, review it carefully to identify the most likely root causes. Look for patterns, repeated issues, or causes that appear across multiple categories.
Prioritize the causes that seem most significant or occur most often. These high-impact causes should be investigated first and addressed to resolve the problem effectively.
Six Major Categories for Root Cause Analysis (The 6Ms)
Selecting categories helps organize potential causes and ensures that no area is overlooked.
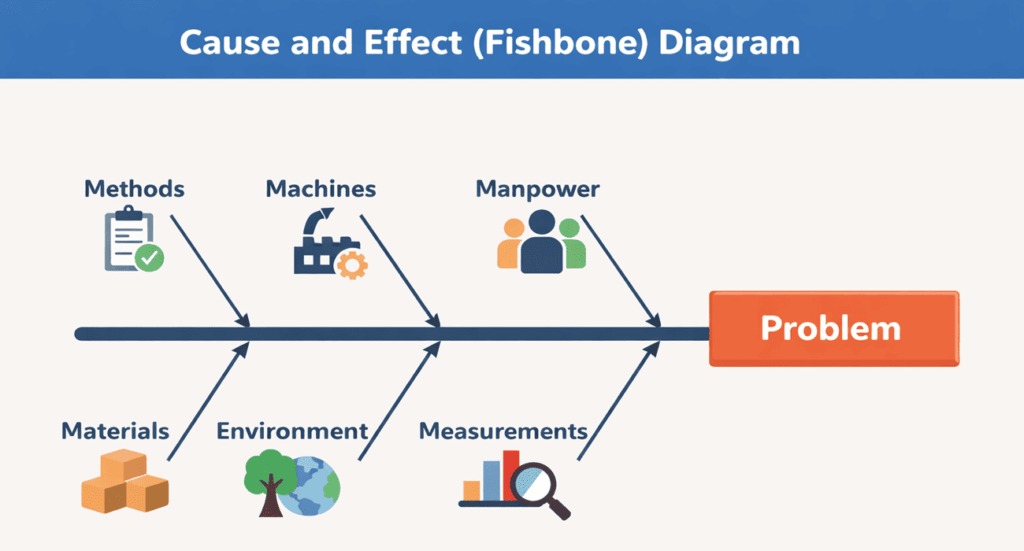
The most widely used framework is the 6Ms:
- Methods – The processes or procedures used to deliver the project. Gaps in training, unclear workflows, or outdated practices fall under this category.
- Machines – Equipment, tools, software, or technology involved. Aging equipment, software bugs, or incompatible systems can be causes.
- Manpower – The people involved, including their skills, knowledge, and communication. Issues such as understaffing, lack of experience, or misaligned roles might contribute.
- Materials – Raw materials, data, or information used in the project. Poor-quality supplies, incomplete datasets, or missing resources can lead to defects.
- Environment – External conditions or context, such as physical workspace, organizational culture, market conditions, or regulatory factors.
- Measurements – Metrics, data collection, and performance indicators. Incorrect data, unclear success criteria, or misinterpretation of metrics can mask the real problem.
The following graphic illustrates the 6Ms in a simple fishbone diagram:
Advantages and Limitations of Fishbone Diagrams
Fishbone diagrams offer several benefits and a few drawbacks. Understanding both helps decide when to use this tool and when another method may be better.
Advantages
- Focus on root causes. Rather than treating symptoms, fishbone diagrams encourage teams to dig deeper into underlying issues.
- Structured brainstorming. Visualizing categories keeps brainstorming sessions organized and ensures that all possible causes are considered.
- Shared understanding. A finished diagram makes it easy for stakeholders to see how causes relate to the problem. It also documents which causes have been explored.
- Low cost. Creating a fishbone diagram requires minimal resources—often just a whiteboard or an online template.
Limitations
- It can become cluttered. Too many branches or unclear categories can make the diagram hard to read. Scribbr’s writing guide warns that too many smaller bones or long explanations defeat the purpose of the exercise.
- May produce irrelevant causes. Without effective facilitation, teams may list causes unrelated to the problem. Irrelevant causes can lead to unnecessary action plans.
- Not always the right tool. Fishbone diagrams are best suited to exploratory problem solving. Complex issues or strategic decisions may require complementary tools like Pareto charts or failure mode and effects analysis (FMEA).
The diagram is most effective when paired with the Five Whys technique and when teams remain unbiased in their evaluation. If not used thoughtfully, the tool can consume time without yielding actionable insights.
Fishbone Diagram Vs Other Root Cause Analysis Tools
| Tool | Best For | When to Use | Complementary to Fishbone |
| Fishbone Diagram | Exploring ALL potential causes | Initial brainstorming, complex problems | Base tool |
| Five Whys | Drilling down to the root cause | After identifying potential causes | Yes – use after fishbone |
| Pareto Chart | Prioritizing major causes | When you have quantified data | Yes – prioritize fishbone branches |
| FMEA | Preventing failures before they occur | Risk management, design phase | Yes – use a fishbone diagram to identify failure modes |
| Scatter Diagram | Finding correlations | When testing cause-and-effect relationships | Yes – validate fishbone hypotheses |
Fishbone Diagrams in Action: Real-World Examples
Fishbone diagrams are more than theoretical exercises; they drive real improvements. In a healthcare quality improvement project at Nyaho Medical Centre in Ghana, staff used a fishbone diagram to address needlestick injuries among employees. After identifying causes across several categories and prioritizing corrective actions, the facility reduced needlestick injuries from 11 in 2018 to 2 in 2021.
This example demonstrates how a structured root cause analysis can lead to measurable improvements in safety and performance.
In another scenario, imagine a software development team facing frequent bugs during deployment. By using a fishbone diagram, they might discover that inadequate testing (methods), outdated development tools (machines), and unclear coding standards (manpower) contribute to the issue.
Addressing these root causes leads to smoother releases and happier customers. The logic applies to any industry—whether you’re improving a business process, reducing defects in manufacturing, or resolving a recurring service issue.
Preparing for the PMP Exam with Cause and Effect Diagrams
The PMP exam expects candidates to know which quality tools to use and when to apply them. The exam content outline emphasizes predictive, agile, and hybrid approaches. Fishbone diagrams appear in questions about Manage and Control Quality, Manage Project Knowledge, and Monitor Risks.
Here are tips to help you use cause-and-effect diagrams effectively on the exam:
- Know the synonyms. Remember that cause-and-effect, fishbone, Ishikawa, fishikawa, and herringbone diagrams refer to the same tool. Questions may use any of these terms.
- Understand the categories. Be ready to identify categories such as Methods, Machines, Manpower, Materials, Environment, and Measurements. Some questions present a partially completed diagram and ask which category a cause belongs to.
- Recognize when to use the tool. Fishbone diagrams are most useful in predictive and hybrid projects when identifying root causes of defects or process issues. In an agile context, they can help teams reflect during retrospectives.
- Integrate with other tools. Consider how a fishbone diagram works with Five Whys, Pareto charts, control charts, and process mapping. Understanding how tools complement one another deepens quality management.
- Practice building diagrams. Draw sample fishbone diagrams for common project problems—delays, cost overruns, quality defects—to internalize the process.
- Review the PMBOK Guide. The current exam references the 7th edition, which focuses on principles and performance domains rather than processes. Understanding how quality tools fit within principles such as team engagement and tailoring will help you adapt diagrams to different project contexts.
FAQs
Q1. What is a cause-and-effect diagram?
A cause-and-effect diagram is a visual tool shaped like a fish skeleton that organizes potential causes of a problem into categories. It helps teams identify root causes rather than symptoms.
Q2. How do I use a fishbone diagram for root cause analysis?
Start by writing the problem at the head of the diagram, draw a spine and branches for categories, brainstorm causes under each category, and then analyze and prioritize the most likely root causes.
Q3. What categories should I use for a fishbone diagram?
Common categories include methods, machines, manpower, materials, environment, and measurements. You can add or modify categories to suit your industry.
Q4. Is the fishbone diagram used in agile projects?
Yes. Although rooted in manufacturing, fishbone diagrams help agile teams during retrospectives to uncover issues in process, tools, or collaboration. The key is to apply the tool iteratively and keep categories relevant.
Summary
Cause-and-effect diagrams are powerful yet simple tools for uncovering why problems occur by mapping potential causes into categories and drilling down through repeated “why” questions. Teams move beyond guesswork. This updated guide aligns with the latest PMP exam content and integrates insights from recent research. Whether you’re studying for the PMP exam or leading a project, mastering fishbone diagrams will help you see beyond surface issues and build a culture of continuous improvement.
Further Readings:
- What are the Seven Basic Quality Tools?
- What is 5 Whys Analysis?
- What is What if Scenario Analysis?
- What is a Scatter Diagram?
- Control Chart Vs Run Chart?
References:
This topic is important from a PMP exam point of view.

I am Mohammad Fahad Usmani, B.E. PMP, PMI-RMP. I have been blogging on project management topics since 2011. To date, thousands of professionals have passed the PMP exam using my resources.


Thanks so much fahad for these brilliant materials. I would like if you will provide also notes for principles of good laboratory practice. Thanks
Hello Juviann, this blog is the PMP exam preparation. If you have any topic related to the PMP exam, let me know, I will try to write on it.
Thanks. How about the elements of risk control and the profit model
Hello Juviann, I did not understand your question.
Please show me how to draw diagram for delay to hand over the construction project on time because of supply chain issues
Sorry Nilantha, I don’t have any example of it.
Traditional methods of Process Improvement demonstrate high failure rates: Business Process Reengineering (BPR) 50% TO 85%, Total Quality Management (TQM) 75% and Six Sigma 90% Proactive methods used in Process Reliability Modeling (PRM) will identify organizational issues before they result in loss of revenue. Traditional methods of Process Improvement demonstrate high failure rates: Business Process Reengineering (BPR) 50% TO 85%, Total Quality Management (TQM) 75% and Six Sigma 90% Proactive methods used in Process Reliability Modeling (PRM) will identify organizational issues before they result in loss of revenue.
When did you post this?
July 2014.
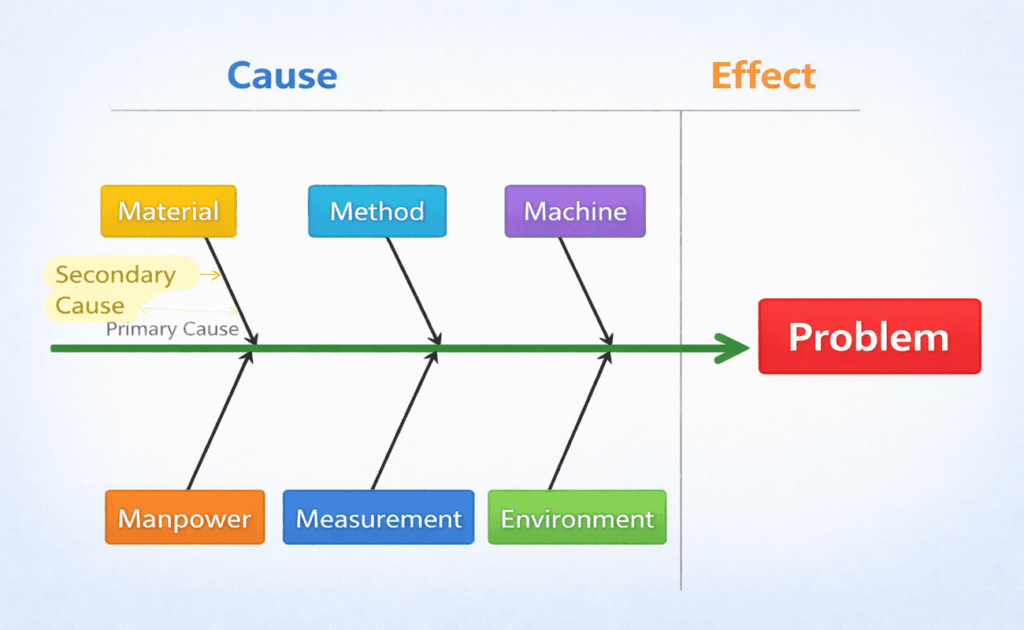
Also the slanted and straight arrows on the fishbone side arrows, what do these indicate?
Refer my reply to your previous comment.
Fahad, can you please explain what does the primary cause and secondary cause on the same branch indicate?
A Primary Cause is one that could lead directly to the effect. For example, a glass that was prematurely leaked water might be caused by a sudden jarring motion such as dropping, which might be listed under the category People if it was associated with handling by a person.
A Secondary Cause is a cause that could lead to a Primary Cause, but does not directly cause the end effect. For example, the cause slippery hands doesn’t make the glass leak water, but it could lead to the glass being dropped. So slippery hands would be listed as a secondary cause under dropping.
Read more at…
https://www.edrawsoft.com/fishbone-diagram-analysis.php
Really good and explicit explanation. I found it very useful and has helped my understanding as I proceed to write my final project. Thank you,
You are welcome Dorika.
Dear Fahad
Can you please throw some light on Pareto charts, especially on Seven Basic tools on quality
thanks n advance
mahesh
Okay. I will write on it soon.
Dear Fahad
The details you have given is crisp and very knowledgeable, to understand.
one really gets hold of the topic after going through once.
my question is how much of it required from PMP exam point of view? do we got to draw and analyse the Fish bone concepts in questions asked?
Thank you in advance
You only need to know the fishbone diagram and its usage. Anyway, more knowledge will not hurt you.
Do you have any excels for creating Earned Value in a Project i could leverage for a fixed Fee Project Please. This project has a project plan but no resources tied to Project plan with proper allocation and r rates. for first 6 months individuals did not even track time so hard to figure out unless i calculate by role and rate …thoughts need your assistance.
Sorry Charlie, I don’t have any excel template for this thing.