Preparing for the PMP exam can feel overwhelming, especially when you look at the long list of PMP formulas you must understand. These PMP Exam formulas are not just numbers to memorize. They help you solve real project problems related to cost, schedule, risk, and project selection.
In the PMP exam, you may face questions on Critical Path Method, Earned Value Management, ROI, and NPV. If you clearly understand PMP formulas and how to apply them, you can answer calculation questions with confidence.
This blog post explains essential PMP exam formulas in simple language, provides clear examples, and shows how each formula connects to real project management practice.
Why PMP Exam Formulas Matter
Project managers use formulas to plan schedules, control costs, and decide whether a project is worth starting. The PMP exam includes questions about these calculations. You will have 180 questions to answer in 230 minutes, with two ten-minute breaks. The exam covers agile and predictive approaches across three domains: People (42%), Process (50%), and Business (8%). Understanding formulas helps you answer questions quickly and correctly.
Earning the PMP certification isn’t just about passing an exam. A survey from the Project Management Institute (PMI) in November 2025 found that PMP-certified professionals in the United States earned a median salary of $135,000, compared with $109,157 for non-certified peers, a 24% difference. The same survey projected that the world will need up to 30 million more project professionals by 2035. Investing time in mastering formulas today can pay off in career growth tomorrow.
How this PMP Exam Formula Guide is Organized
Each section covers a set of formulas you need to know. We start with scheduling formulas used in the Critical Path Method. Then we move on to Earned Value Management, estimating techniques, general project management equations, and project selection metrics. Illustrations and examples accompany each group. At the end, you’ll find tips for studying and a brief FAQ.
Let’s get started.
Critical Path Method (CPM) Formulas
The Critical Path Method helps you identify the sequence of activities that determines the project’s minimum duration. By calculating early and late start and finish times, you can find the path with no slack and monitor schedule risk.
Key Concepts
- Earliest Start (ES) – the earliest time an activity can begin, based on when predecessors finish.
- Earliest Finish (EF) – the earliest time an activity can finish.
- Latest Start (LS) – the latest time an activity can begin without delaying the project.
- Latest Finish (LF) – the latest time an activity can finish without delaying the project.
- Total float (slack) – the amount of time an activity can be delayed without affecting the project finish date.
- Free float – the amount of time an activity can be delayed without affecting the start of any successor activity.
Formulas and Examples
The following equations are based on standard scheduling practice.

A trusted article from Wrike explains how to compute them:
| Concept | Formula | Explanation |
| Earliest Start (ES) | Maximum EF of all predecessor activities | To start a task, all predecessors must finish. Choose the largest early finish among its predecessors. |
| Earliest Finish (EF) | ES + Duration | Add the task’s duration to its earliest start time. |
| Latest Finish (LF) | Minimum LS of all successor activities | To finish without delaying the project, finish before the next tasks must start. |
| Latest Start (LS) | LF – Duration | Subtract the task’s duration from its latest finish. |
| Total Float (Slack) | LS – ES or LF – EF | The amount of time a task can be delayed without affecting the project finish date. |
| Free Float | ES of next task – EF of current task | The time a task can slip without delaying the start of its successor. |
To illustrate these relationships, see the infographic below. It shows each formula with arrows connecting predecessor and successor tasks. Study the graphic and note how early and late dates are calculated.
Example: Imagine a task (Task B) that depends on Task A. Task A finishes at day 4, and Task B takes three days.
The earliest start for Task B is day 4. Its earliest finish is day 7 (4 + 3). If the latest finish of the whole project is day 10, the latest start for Task B is day 7 (10 – 3).
The total float is 7 – 4 = 3 days.
Earned Value Management (EVM) Formulas
Earned Value Management combines schedule and cost data to measure project performance. It tells you whether you are ahead or behind schedule and under or over budget.

A comprehensive guide from Ten Six lists these formulas.
Below is a summary:
| Metric | Formula | Interpretation |
| Planned Value (PV) | Budgeted cost of planned work | Also called BCWS (Budgeted Cost of Work Scheduled). It represents the value of work that should have been performed by a certain date. |
| Earned Value (EV) | BAC × % complete | Also called BCWP (Budgeted Cost of Work Performed). It shows the value of work actually completed. |
| Actual Cost (AC) | Sum of actual spending to date | Also called ACWP. |
| Cost Variance (CV) | EV – AC | Positive CV means under budget; negative CV means over budget. |
| Schedule Variance (SV) | EV – PV | Positive SV means ahead of schedule; negative SV means behind schedule. |
| Cost Performance Index (CPI) | EV – AC | A ratio above 1 shows cost efficiency. |
| Schedule Performance Index (SPI) | EV – PV | A ratio above 1 shows schedule efficiency. |
| Estimate at Completion (EAC) | AC + estimate for remaining work | Predicts the total project cost at completion. |
| Variance at Completion (VAC) | BAC – EAC | Positive VAC means you expect to finish under budget. |
| To Complete Performance Index (TCPI) | (BAC-EV) / (BAC-AC) Or (BAC-EV) – (EAC-AC) | Cost efficiency is needed to stay within the budget. A value above 1 means you must improve efficiency. |
Use the following infographic for a visual summary. It groups the formulas under cost and schedule categories and shows how they relate.
Example: Suppose a project has a Budget at Completion (BAC) of $100,000. After one month, the project is 40% complete, has spent $45,000, and should have spent $50,000.
PV equals $50,000; EV equals $40,000 (0.4 × $100,000). AC equals $45,000.
CV = EV – AC = $40,000 – $45,000 = -$5,000 (over budget).
SV = EV – PV = $40,000 – $50,000 = -$10,000 (behind schedule).
CPI = EV / AC = 0.89.
SPI = EV / PV = 0.80.
Estimating Techniques
Estimation helps predict costs and durations when there is uncertainty. The PMP exam tests a few simple methods.
Three-Point Estimating
This technique uses optimistic (O), most likely (M), and pessimistic (P) estimates. There are two common formulas:
- Triangular distribution: (O + M + P) / 3. This formula averages the three estimates equally.
- PERT (Program Evaluation and Review Technique): (O + 4M + P) / 6. This formula gives more weight to the most likely value.
For example, if building a feature could take 3, 5, or 9 days, the triangular estimate is (3 + 5 + 9)/3 = 5.67 days. The PERT estimate is (3 + 4×5 + 9)/6 = 5.33 days.
Expected Monetary Value (EMV)
EMV is used in decision tree analysis. Multiply each possible outcome by its probability and add the results.
For example, if a project has a 70% chance of earning $20,000 and a 30% chance of losing $10,000, the EMV is (0.70 × $20,000) + (0.30 × (-$10,000)) = $14,000 – $3,000 = $11,000.
A positive EMV suggests the decision is favorable.
Standard Deviation and Range
Standard deviation helps assess risk in estimates. For PERT estimates, the standard deviation of the activity duration is (P – O) / 6, and the range is (P – O). Smaller values indicate less uncertainty.
General Project Management Formulas
Communication Channels
The number of potential communication channels grows quickly as team size increases. The formula is:
Channel = n(n-1)/2
where “n” is the number of stakeholders or team members.
If a team has 6 members, the number of channels is (6×5)/2 = 15. This highlights why clear communication plans are crucial.
Benefit-Cost Ratio (BCR)
BCR measures the relationship between a project’s benefits and its costs. The formula is:
BCR = (Present Value of Benefits)/(Present Value of Costs)
A BCR greater than 1 means benefits exceed costs. When comparing options, choose projects with the highest BCR.
Resource Utilization and Productivity
- Resource Utilization: Actual hours worked ÷ Available hours. For example, if a developer worked 30 of 40 available hours, the utilization is 0.75 (75%).
- Productivity: Output ÷ Input. If a team produced 120 deliverables using 150 labor hours, productivity is 120 ÷ 150 = 0.8 units per hour.
Risk Assessment
In addition to EMV, risk management uses the formulas:
- Risk exposure: Probability × Impact. For example, a 20% chance of a $50,000 cost overrun yields a risk exposure of $10,000.
- Risk priority number: Severity × Occurrence × Detection, used in Failure Mode and Effects Analysis (FMEA).
Project Selection and Financial Metrics
Before starting a project, you need to decide whether it makes financial sense.
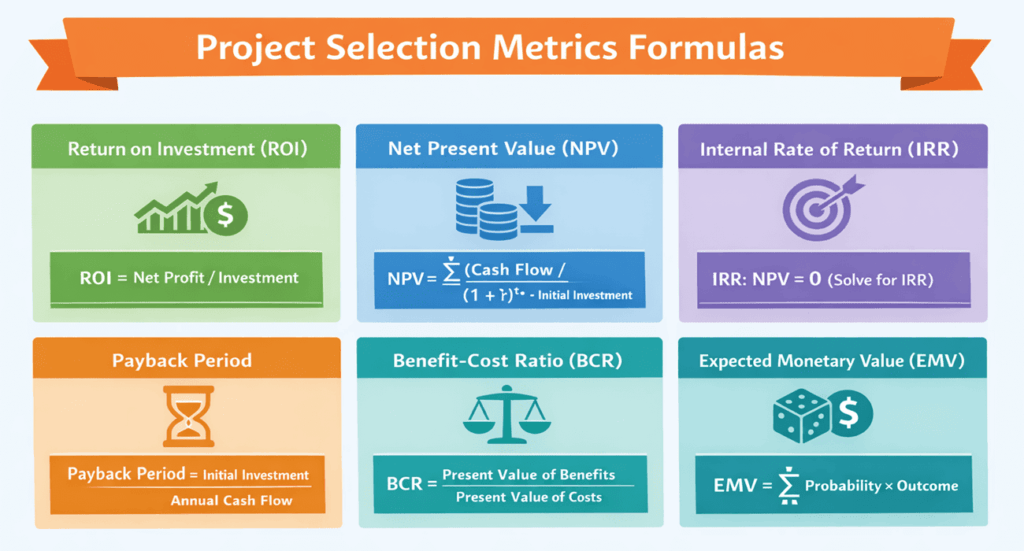
Several metrics help evaluate profitability. The formulas below are widely accepted in project finance. The third infographic summarizes them visually.
| Metric | Formula | Description |
| Return on Investment (ROI) | Net Profit ÷ Cost of Investment | Measures how much profit a project returns relative to its cost. Positive ROI indicates a gain. |
| Net Present Value (NPV) | SUM [(Cash Flow)/(1+r)^t] – Initial Investment | Computes the present value of future cash flows discounted at rate r. A positive NPV means the project adds value. |
| Internal Rate of Return (IRR) | Discount rate that makes NPV = 0 | IRR is the rate at which the project breaks even in present value terms. Higher IRR values are more attractive. |
| Payback Period | Initial Investment ÷ Annual Cash Flow | Shows how long it takes to recover the initial investment. Shorter payback periods reduce risk. |
| Benefit-Cost Ratio (BCR) | Present Value of Benefits ÷ Present Value of Costs | See above. |
| Expected Monetary Value (EMV) | Sum of (Probability × Outcome) | See above. |
Example: A project requires an investment of $80,000 and is expected to generate $25,000 in net profit per year for five years.
The ROI is ($25,000 × 5 – $80,000) ÷ $80,000 = 0.56 or 56%. If the discount rate is 8%, you would discount each year’s $25,000 return to the present to compute NPV.
A positive NPV and an IRR above the discount rate suggest the project is worthwhile.
Why These Formulas Matter
Mastering formulas isn’t just about passing an exam. In the real world, they help you make informed decisions. Schedules stay on track when you calculate float. Budgets stay under control when you monitor cost performance indexes. Business cases become clear when you compute NPV and ROI. With the demand for project talent expected to grow by tens of millions, employers value professionals who can use data to guide projects. The salary premium for PMP holders proves that this knowledge pays off.
Study Tips and Strategies
- Create Flashcards. Write each formula on one side and its definition on the other. Review them daily.
- Practice Problems. Solve sample questions from textbooks or exam prep courses. Apply each formula until it becomes second nature.
- Use Mnemonics. For example, remember “EV over AC = CPI” to recall the Cost Performance Index formula.
- Visualize Relationships. Refer to the infographics above. Drawing your own diagrams reinforces memory.
- Simulate Exam Conditions. Time yourself when solving calculation questions. This helps manage stress during the test.
FAQs
Q1. What is the difference between total float and free float?
Total float measures how long you can delay an activity without delaying the project finish. Free float shows how long you can delay an activity without delaying its immediate successor. Free float is always less than or equal to total float.
Q2. How do I know if a project is profitable?
Calculate financial metrics like NPV, IRR, and ROI. If NPV is positive and the IRR exceeds your required rate of return, the project is likely profitable. ROI shows the percentage gain relative to cost.
Q3. Why is the Earned Value formula important?
Earned Value (EV) converts the percentage of work completed into a dollar value. It allows you to compare planned progress against actual costs, revealing performance trends early.
Q4. How often should I update EVM metrics?
Update at regular reporting intervals, weekly or monthly. Frequent updates provide timely insights, enabling corrective action before problems become crises.
Q5. Is the Payback Period enough to choose a project?
Payback Period measures how quickly you recover your investment, but it ignores cash flows after breakeven and the time value of money. Combine it with NPV and IRR for a fuller picture.
Summary
Mastering PMP formulas is a key step toward passing the PMP exam and becoming a confident project leader. These formulas help you control schedules, manage costs, evaluate risks, and select the right projects. When you understand how PMP exam formulas work, you move beyond memorization and start thinking like a true project manager. Practice regularly, review examples, and use visual aids to strengthen your knowledge. With consistent effort, these PMP formulas will become powerful tools in both the exam and real projects.

I am Mohammad Fahad Usmani, B.E. PMP, PMI-RMP. I have been blogging on project management topics since 2011. To date, thousands of professionals have passed the PMP exam using my resources.