A Program Evaluation Review Technique (PERT) Chart is a graphical technique showing project activities and key milestones on a timeline. This project management tool lets you develop your project schedule and communicate the timeline to stakeholders.
Developing a schedule is a complex task requiring a thorough knowledge of schedule network diagramming techniques and experience.
Diagramming techniques include:
- Critical Path Method (CPM)
- Critical Chain Method (CCM)
- Gantt Chart
- Program Evaluation and Review Technique (PERT)
You can use PERT when you cannot estimate the activity duration with certainty.
The U.S. Navy developed this technique in 1957 to successfully plan the schedule for the Polaris Project.
It is a statistical tool mainly used in research projects where you cannot accurately predict the duration of activities and must plan your work based on milestones. A milestone is a significant point or event in a project, like a kick-off meeting or completing a major deliverable.
The PERT helps you develop the schedule for large, complex, and one-time projects when no historical information is available. The PERT uses a three-point estimation technique.
How Does Program Evaluation Review Technique (PERT) Chart Work?
A PERT chart has circles and arrows. Circles known as nodes represent milestones, and arrows represent duration. PERT chart uses only one type of activity relationship: finish to start (FS).
Nodes are connected using an arrow, which denotes the duration between two milestones. If Node-1 is connected with Node-2, Node-1 must be achieved before you reach the second Node-2.
The image below shows an example of a PERT chart:
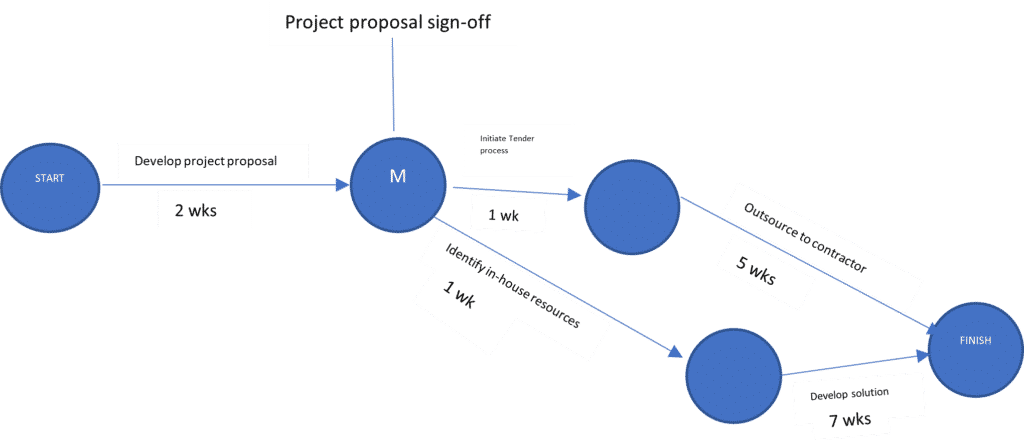
You can use the PERT chart to develop a project network diagram and estimate the project duration. Afterward, you can develop the project schedule, estimate the project cost, and then the budget.
A PERT diagram can have many paths; the path with the longest duration is the critical path, which is the duration of your project. The activities on this path are critical, and any delay in these activities will affect the project duration.
The PERT chart is similar to the Critical Path Network or Critical Chain Network diagram but with some differences. The PERT uses one type of activity dependency, Finish to Start, whereas the other two can use any task dependency. Also, on the PERT diagram, activity duration is on the arrow, and the node represents a milestone, while the other two have activities on their nodes.
Three-Point Estimate Technique (Using PERT Formula)
This technique uses three estimates to arrive at a final estimate. This weighted average method reduces bias and uncertainty from the estimation and improves accuracy.
These three estimates are:
- Most Likely Estimate
- Optimistic Estimate
- Pessimistic Estimate
The PERT technique is based on beta distribution, a probability distribution suitable for factoring uncertainties in estimating.
A brief look at the beta probability distribution shows how the probabilities for most likely, optimistic, and pessimistic estimates are assigned.
The most likely estimate takes the highest probability (about 0.5 or 50%), while the pessimistic and optimistic take about 0.1 or 10%. The shorter duration represents optimism, while the longer represents pessimism.
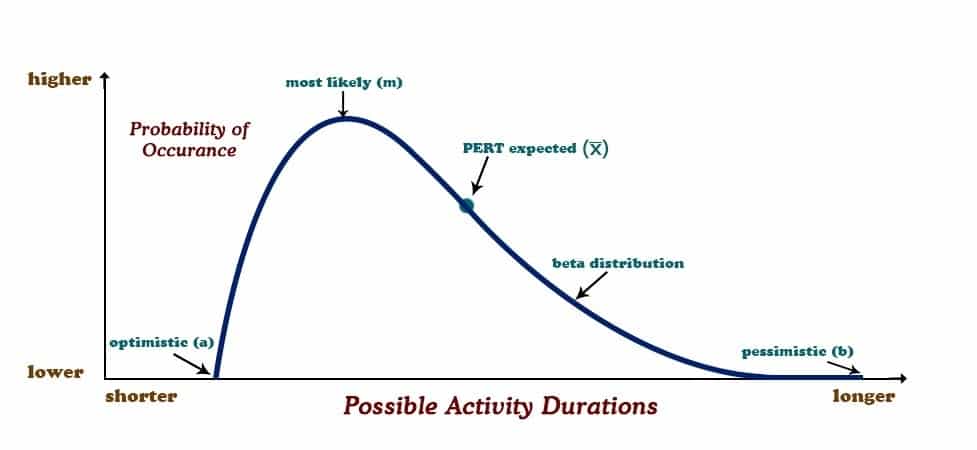
Another insight from the beta distribution is a skew (flattening to the right), which tells us how (in most cases) our estimate is tilted towards optimism rather than the pessimistic end.
This distribution captures the reality of estimation.
The PERT Formula
The PERT formula to calculate the PERT estimate is as follows:
PERT Estimate = (Tp + 4Tm + To) / 6
and
Standard Deviation SD = (Tp – To) / 6 while
Variance is the square of the SD.
Where:
Most Likely Estimate (Tm): The chance of completing an activity is highest within this duration.
Optimistic Estimate (To): Here is a best-case scenario, considering all favorable conditions. This is the shortest duration to complete the task.
Pessimistic Estimate (Tp): This is a worst-case scenario. Here, you determine the estimate by considering all unfavorable conditions and the longest time the activity may take to complete.
The PERT estimate removes uncertainties around the duration estimate by providing three task duration possibilities. It provides a better estimate by considering all possible scenarios.
It is also useful in risk analysis, where it uses three estimates. In addition, it helps the Monte Carlo simulation generate a statistical analysis of the probability of completing the project within budget or schedule.
A Step-by-Step Guide to Creating a PERT Chart
You can follow the following steps to create a PERT chart:
1. Define the Project Scope
- Identify all tasks or activities required to complete the project.
- Break down the project into smaller, manageable tasks or milestones using a work breakdown structure.
2. Determine Task Sequence
- Determine the order in which tasks need to be performed.
- Identify which tasks are dependent on others and which can be done concurrently.
3. Establish Time Estimates
- Estimate the time required for each task. Use three estimates: optimistic, pessimistic, and most likely.
- Calculate the expected time for each task using the PERT formula.
4. Draw the PERT Chart
- Start with a node for each event. Draw circles representing key milestones.
- Connect the nodes with arrows to show the sequence and dependencies. The arrows point from the start of a task to its end.
- Include labels or notes for each milestone to provide additional details.
5. Identify the Critical Path
- Determine the longest path through the network of tasks. This path, known as the critical path, shows the minimum project duration and highlights tasks that cannot be delayed without affecting the overall project timeline.
6. Review and Adjust
- Review the chart to ensure all tasks and dependencies are correctly represented.
- Adjust the chart as needed based on project changes or additional information.
7. Update Regularly
- As the project progresses, update the PERT chart to reflect any changes in task status, durations, or dependencies.
Example of PERT Chart
Your team members tell you that an activity you are working on will most likely be completed in 20 days. However, in the worst case, it takes 30 days; if all conditions are favorable, you can complete it in 15.
Determine the PERT time estimate for this activity.
Solution:
To determine the PERT estimate, we need the activity’s Optimistic Time, Pessimistic Time, and Most Likely Time.
The question suggests that you can likely complete the task in 20 days; hence, the Most Likely Time = 20 days.
It also says that in the worst case, it may take 30 days; hence, the Pessimistic Time = 30 days.
Finally, it says that if all conditions are favorable, the task will take 15 days to complete; hence, the Optimistic Time = 15 days.
Now, we can use the PERT formula.
PERT Estimate = [Optimistic Time + 4 X (Most Likely Time) + Pessimistic Time] / 6
= [15 + 4*20 + 30] / 6 = [15 + 80 + 30] / 6 = 125 / 6 = 20.83 days
Hence, the PERT estimate for this activity is 20.83 days.
Let’s examine the confidence of these estimates. If it is high, the spread between the min and max will be less, and the S.D. will be less.
SD = (Tp – To) / 6
= (30-15)/6
= 2.5
Imagine that the pessimistic estimate is 60 days. This implies a low level of confidence, a higher spread, and the deviation from the mean (PERT estimate) will be more.
SD = (Tp – To) / 6
= (60-15)/6
= 7.5
Pros and Cons of PERT Charts
A few advantages and disadvantages of PERT charts are as follows:
Pros
- Visual Representation: It provides a clear, graphical view of project tasks and their interdependencies, making understanding the project structure easier.
- Identifies Critical Path: This helps determine the longest path through the project, known as the critical path, which is essential for understanding the minimum project duration and managing deadlines.
- Flexible and Adaptable: Allows for adjustments as project details and schedules change, making it easier to accommodate modifications and updates.
- Improves Time Management: Assists in identifying potential bottlenecks and areas where delays could occur, enabling proactive management to keep the project on track.
- Enhances Communication: Facilitates better communication among project stakeholders by providing a common reference point for understanding project progress and dependencies.
- Supports Project Scheduling: It aids in scheduling and allocating resources effectively, helping ensure that all tasks are completed on time.
Cons
- Complexity: It can become complex and difficult to manage for large projects with many tasks and dependencies, potentially overwhelming project managers.
- Time-Consuming to Create: Developing a detailed PERT chart can be time-consuming, especially for projects with many tasks and relationships.
- Requires Accurate Estimates: Relies heavily on accurate time estimates for each task. Inaccurate estimates can lead to incorrect scheduling and planning.
- Limited Scope for Resource Allocation: It does not inherently address resource allocation or management; it focuses mainly on task sequencing and time management.
- Maintenance: Updating the PERT chart as the project progresses can be labor-intensive, especially with frequent changes.
- Potential for Overemphasis on Time: This may lead to an overemphasis on scheduling and time management at the expense of other important factors such as cost and quality.
- This is an optimistic model that assumes resources will be available.
PERT Charts Vs Gantt Charts
Gantt and PERT charts are project management tools for different purposes. A Gantt chart shows tasks as horizontal bars along a timeline. It visually displays when tasks start and finish and how long they take. This makes it easy to see the schedule and track progress.
The image below shows a Gantt chart:
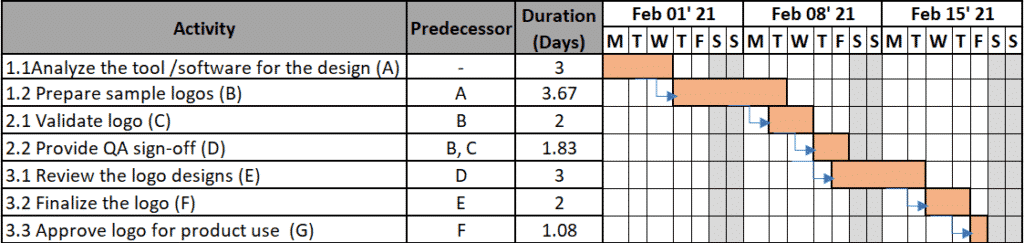
A PERT chart, on the other hand, uses nodes and arrows to show task sequences and dependencies. It focuses on the relationships between tasks and helps identify the critical path, the longest sequence of tasks that determines the project’s duration.
Gantt charts are better for tracking schedules and progress, while PERT charts are useful for understanding task dependencies and planning complex projects.
PERT Chart Vs CPM
Critical Path Method (CPM) and PERT are both project management tools for identifying critical activities and estimating project duration. However, they differ in their approach to time estimation.
CPM assumes deterministic activity times, meaning the duration of each task is known with certainty. It is ideal for projects with well-defined activities and predictable schedules.
PERT handles probabilistic activity times, using optimistic, pessimistic, and most likely estimates for task durations. This makes it suitable for projects with uncertain or complex activities.
The following are a few differences between PERT and the critical path method:
- CPM is activity-oriented, while PERT is event-oriented.
- Duration estimates are definitive in CPM but not in PERT. In other words, CPM uses deterministic values, and PERT uses probabilistic values.
- The CPM diagram shows the activity on the node, while this is shown on the arrow in the PERT chart. Nodes represent the milestones. Therefore, many experts call the PERT result an Activity on Arrow (AOA) diagram.
- The PERT chart has a “Finish to Start” relationship, while the CPM diagram can have any dependency: Start to Finish, Finish to Start, etc.
- On a CPM diagram, rectangles represent the nodes, while circles represent nodes on the PERT chart.
Summary
The PERT is a network diagramming technique for projects with high uncertainties. This tool helps project managers develop a sound schedule when precise activity duration is unavailable. In the PERT chart, nodes are milestones, and activities are on arrows.
The success of the PERT depends on the professionals’ experience. The project manager’s job is to remove biases from the estimation, which can affect the PERT estimation and schedule.
Further Readings:
- What are Project Milestones?
- What is the Precedence Diagramming Method?
- What is a Project Network Diagram?
- What is the Critical Path Method?
- What is the Critical Chain Method?
- Total Float Vs Free Float
- What is the Project Timeline?
This topic is important from a PMP exam point of view.

I am Mohammad Fahad Usmani, B.E. PMP, PMI-RMP. I have been blogging on project management topics since 2011. To date, thousands of professionals have passed the PMP exam using my resources.


hi i have a question
Sure Joe.
I got answer for te as integer type.I convert into non integer .for example 4.5=5 .whether it is correct or not?
If you must change to non decimal, as per my understanding you should go for 5. If an activity is completing in 4.5 days, you can not say it as 4.0 because you may be in trouble while competing the activity.
However, 5 is safe.
Very Helpful.. Thanks !
You are welcome…
Bro
I want to know about this PERT Estimate = (To + 4Tm + Tp) / 6 formula
Why we take “4tm” in the formula.
Can you evaluate bro
Please
This is weighted average, that is why we have given more weightage to optimistic time. Derivation of this formula is out of scope of the PMP exam.
Yes, you can but it depends on the project and deliverable. Many times milestones cannot be a deliverable but a point, specially in a research project.
Hi Fahad,
Milestone vs Deliverable:
A Milestone includes 1 or more Deliverable, a Milestone cannot be delivered in itself to the Client, as it is only a point in time on the schedule with zero duration, while the Deliverable is a product that will require delivery to the Client.
Therefore, I would suggest using Deliverable rather than Milestone on the Node for PERT.
Example: prelim design completion is a Milestone while prelim design report, plan etc are deliverables.
Your Thoughts
Can you show me the calculation?
Hi Fahad,
We have a question where we need to calculate the most optimistic time. The most likely time is given as 20, most pessimistic is 60, and expected is 10. This yields a negative answer for the most optimistic duration (-80). Is that possible and what does that mean?
Hello Fahad,
Just wanted to thank you for your clear and easy to understand comments helping all the interested parties, through your blogs.
Keep on the good job, its much appreciated!
AA
Thank you AA for your visit and leaving comment.
How do we calculate variance and probability?
These are mathematical concepts and cannot be explained here.
Hi sir,
What does Primavera and MS Project uses? PERT or CPM?
I dont have experience in either of two software.
Hi
I am giving exam this month end
what different types of question will come on PERT ,CCM, and CPM or infact on Time management chapter .
Hello Savita, I have written detailed blog posts on CCM and CPM. Please visit the following page to find such blog posts and study them.
https://pmstudycircle.com/study-notes/
I head Activity on Node method is not allowed in PERT, Only activity on arrow works
IS it true, if yes why and if no then also y?
PERT diagram are based on milestones that is why they are called activity on arrow diagram.
Can we find out Variance in Beta distribution or triangular distribution just by taking Square of St deviation?
Thanks
Variance is the spread between many data sets, not application for a single activity.
Hi there, so I have a project about PERT. The question is whats the most likely activity time for x activity (nearest day) be adjusted to if the probability of any path through the network being completed in 69 days must not be less than 0.94?
1. Can I use Bottom-up Estimate for calculating duration of an activity?
2. In your above notes standard deviation that is 2.5 where we use it, if iam not wrong in finding Early start that could be 18.33 and late finish could be 23.33 is that ok, or it has some other means, please let me know.
For the project duration, you can go for the bottom up estimation, not for an activity.
It should be activity start date between 18.33 to 23.33
Fahed
As per PMP book , we can use bottom up estimation in the calculation of activity resources or activity cost , how we can use it for the project duration ?
You will add all activities duration to get the total project duration.
Bro
I want to know about this PERT Estimate = (To + 4Tm + Tp) / 6 formula
Why we take “4tm” in the formula.
Can you evaluate bro
Please.
Hi Fahad,
In PERT or AOA,which relationship is used.. Is it FInish to start or Start to finish.and please explain why..
It is Finish to Start because PERT is an event oriented network diagram.
As per your notes “PERT Diagram can only have a “Start to Finish” type of relationship, while the CPM method can have any type of dependency; e.g. Start to Finish, Finish to Start, etc.
You replied to SWAPNA ” It is Finish to Start because PERT is an event oriented network diagram
Which one is correct your notes or your reply to SWAPNA, please explain. Thanks
This was an error, and I have corrected it. In PERT you will only have finish to start type of relationship.
I did appeared in the PMP exam in July 2013 but unfortunately could not passed, can I take a date for my exam in 2015 year, am I still eligible to write an exam. I am already been doing preparation for PMP exam with the help of your exam preparing material.
Waiting for reply
Thank you very much
Tauseef Qureshey
Since you attempted the exam on July 2013, it is now more than one year; therefore, you eligibility is expired.
So, if you want to sit for the exam now, you have to re-apply for it.
When I can use Triangular distribution formula and when I can use Beta distribution?
In triangular distribution you use three parameters: minimum, mode (most likely), and maximum. PERT is based on the triangular distribution.
In beta distribution you get a curved shape. You can say that the triangular distribution is a simpler form of beta distribution.
Traditional PERT is based on Beta Distribution. However, triangular distribution are also used. If not informed specifically in the question, I’ll say use beta distribution formula, not triangular distribution.
Triangular Distribution is simpler form of beta distribution.
Hi
I am currently tyring to get ready for the PMP exam and following you regularly. You are helping out us a lot throughout this journey :) just I would like to ask you that how standart variation can be used in a project? Does it mean that in your example, this job can be finished between 18.33 days and 23.33 days? And can I use this numbers as early start and Late finish in AON?
Hello Gokhan,
Early start and late finish dates are determined the same way as you do in Critical Path Method.Please explain how ES and EF dates can be find out in PERT, need example to calculate.
Thank you very much
In PERT you have most likely, optimistic and pessimistic estimate. Early start, early finish, etc are used in critical path.
thank you so much you explain everything so well. Could you do a simple calculation on decision trees as they pertain to the EMV
Hello Sunshine,
soon you will see a post on Earn Value Management and Decision Tree.
please share eBook name
Here is the link for eBook:
https://pmstudycircle.com/pmp-question-bank/
Okay, keep up the great work!
SA Fahad,
I took my exam yesterday, and did really well. I prepared for the exam well by not only reading Kim Fieldman’s and other book, but also reading and clarify many topics from Pmstudycircle.com. Your journals were brief, clear, and with good examples. In my opinion, you should write a book …
Thank you,
Hotaki
WAS Hotaki,
Thanks for your comments and I am happy that my blog helped you pass the exam.
I have already written an ebook on pmp practice questions, and second ebook is on its way…
:)
Fahad
Bro,
thanks for your explanation.
I just would to correct that 4×20=80, Not 60
Many Thanks.
Corrected.
Corrected.