Clarified roles and responsibilities are crucial in project management. Without understanding who is responsible for what, team members will be confused, and tasks will fall through the cracks. This can cause missed deadlines and derail projects.
This is where RACI charts come into play. RACI, which is a responsibility assignment matrix, stands for Responsible, Accountable, Consulted, and Informed. It is a powerful tool for defining and communicating the roles and responsibilities of stakeholders.
Creating a RACI chart in Excel is a simple process that can help you streamline your efforts.
The step-by-step guide on how to create an RACI chart in Excel is as follows:
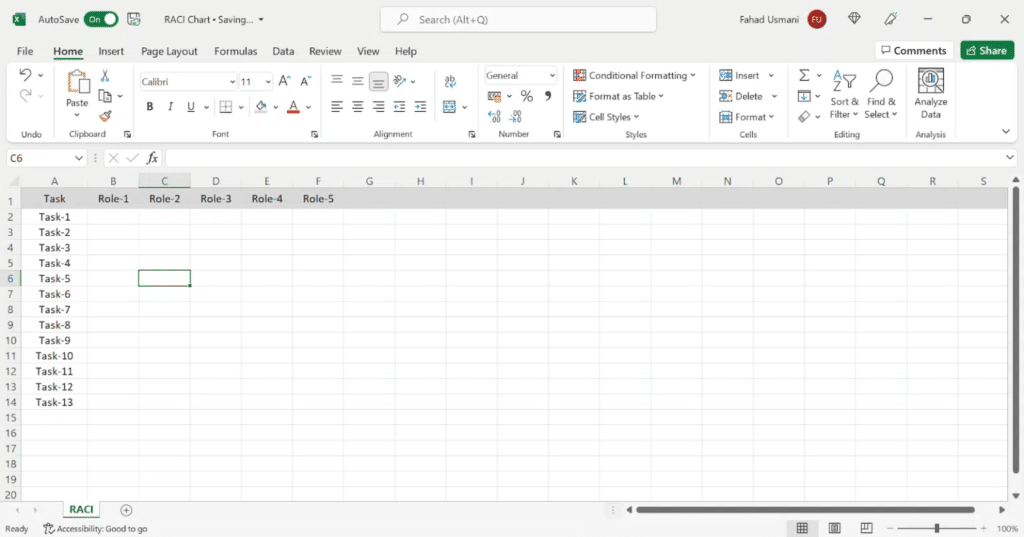
Step 1: Add Tasks to the First Column
Open Microsoft Excel and create a new worksheet. Identify all the tasks that you will include in the chart. List these tasks in the first column.
Step 2: Add Team Roles in the Top Row
From the second column, label each column with your project role.
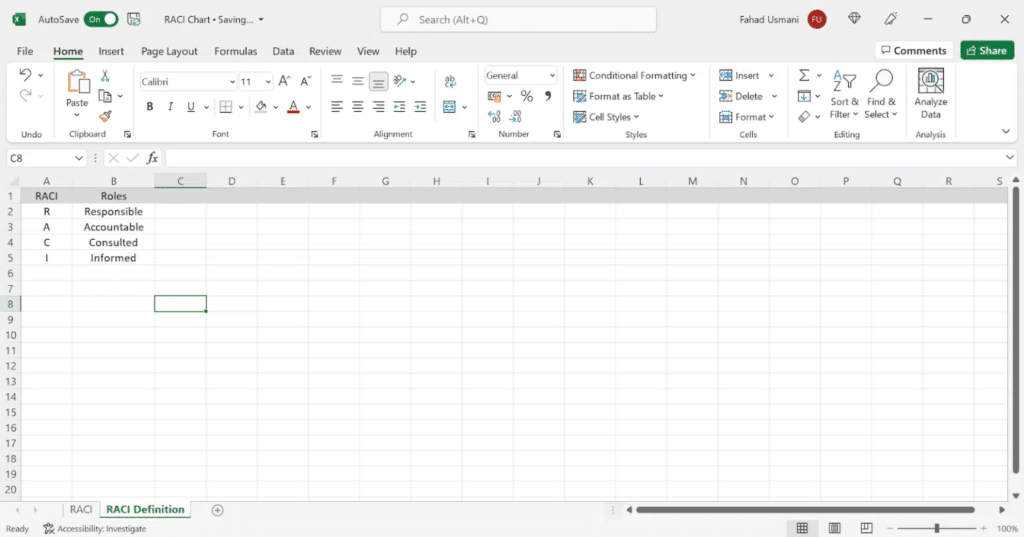
Step 3: Define RACI Roles
Click “+” at the bottom to insert a new sheet.
Go to your new worksheet and enter the details as shown below. You can add the same information below the RACI chart.
Step 4: Add a Drop-Down List of Roles
Go to your main worksheet and click the first cell.
Click Data >Data Validation on the ribbon and insert a drop-down list with RACI roles.
In the Settings tab, choose List under the Allow menu.
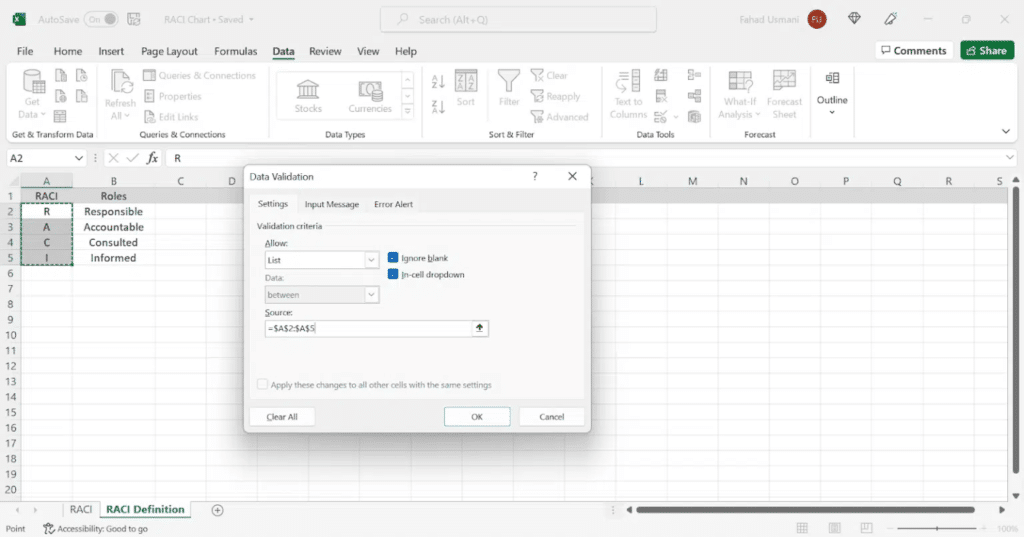
Click the Source field and highlight the data range with RACI options from the RACI Roles and Definitions worksheet.
Ensure Data validation settings are correct, then hit Enter to add the drop-down list to cells.
Copy and paste that cell to apply the drop-down list to other cells in the RACI template sheet. You can do the same process here if you have defined the RACI role on the main sheet.
Step 5: Assign a RACI Value to All Tasks
You can now fill out the RACI chart.
Go to the list of tasks and assign responsibility to each task.

Step 6: Add Color Formatting (Optional)
You can add color formatting to your RACI chart to add interactivity. Highlight the cells containing the R, A, C, and I initials with different colors to distinguish between them easily. This step is optional but can make your chart more visually appealing and easier to interpret.
Step 7: Review and Share
Once your RACI chart is complete, review it to ensure accuracy and completeness. Share the chart with stakeholders to ensure that everyone understands their roles and responsibilities. Regularly update the chart as the project progresses and roles evolve.
Summary of Steps
Here is a summary of the steps required to create a RACI matrix in Excel:
- Add Tasks to the First Column
- Add Team Roles to the Top Row
- Define RACI Roles
- Add a Drop-Down List of Roles
- Assign a RACI Value to All Tasks
- Adding Color Formatting (Optional)
- Review and Share
Conclusion
Creating a RACI chart in Excel is a simple way to clarify roles and responsibilities. By defining roles and responsibilities for each task, you can streamline communication, improve collaboration, and increase the chances of project success. With this step-by-step guide, you can create your RACI chart in Excel and take your project management efforts to the next level.

I am Mohammad Fahad Usmani, B.E. PMP, PMI-RMP. I have been blogging on project management topics since 2011. To date, thousands of professionals have passed the PMP exam using my resources.