Have you ever stared at a long list of risks and felt unsure where to begin? Many project managers experience this overwhelm, especially when faced with dozens of potential threats. A risk assessment matrix (or risk matrix) turns that chaos into clarity.
This simple grid plots the likelihood of a risk occurring against its impact on your project. By visualizing risks, you can determine which require immediate attention and which can be monitored.
What is a Risk Assessment Matrix?
A risk assessment matrix, also known as a Risk Matrix, is a visual tool used in project management to evaluate and prioritize risks by plotting each risk’s likelihood (probability) against its potential impact. The grid helps you quickly identify high-priority risks and communicate them to stakeholders.
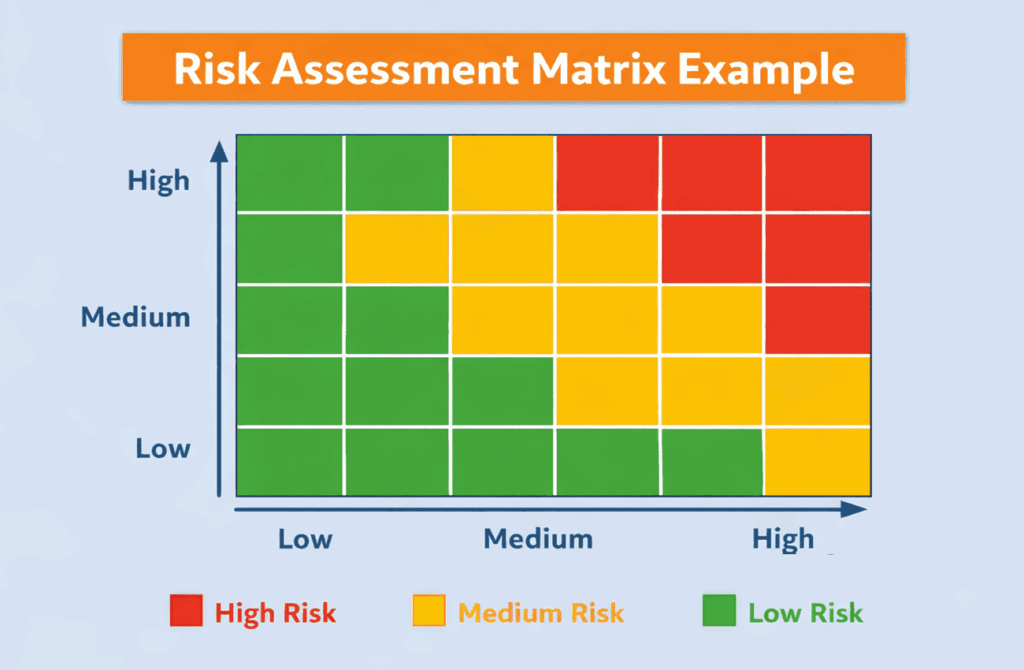
Example risk matrix infographic showing a 5×5 grid with low risk (green) at bottom left, medium risk (yellow) in the center, and high risk (red) at top right, with probability on the X-axis and impact on the Y-axis.
The matrix often uses color-coded zones—green for low risk, yellow for medium risk, and red for high risk—to indicate where action is needed. By seeing risks on a single chart, team members gain a shared understanding of where to allocate resources.
What is the Importance of a Risk Matrix?
Risk management is no longer optional. PMI’s “Maximizing Project Success” research showed that projects with established measurement systems—including risk monitoring—achieved success rates nearly twice those of projects without such systems.
The same study found that 81% of projects that monitored risks had a Net Project Success Score of 41, while those without risk monitoring scored only 14. These numbers underscore the critical importance of visualizing risks early and updating them frequently.
At the same time, Aon’s Global Risk Management Survey lists cyber-attacks, business interruption, and economic slowdowns as the top global risks. With such volatile threats, a robust risk assessment matrix helps organizations respond proactively rather than reactively.
When to Use a Risk Assessment Matrix
The risk matrix is most effective during qualitative risk analysis, which occurs after identifying risks and before selecting mitigation strategies.
Use the matrix when:
- Planning a Project: Plot risks early so the team can anticipate major threats and adjust scope, budget, or schedule accordingly.
- Introducing New Processes or Systems: Any change can introduce unknown risks. A risk matrix helps you visualize which changes carry higher stakes.
- Adapting to New Information: When new risks surface or existing risks change, updating the matrix helps maintain an accurate picture of project exposure.
- Preparing for Audits: Frameworks such as ISO 27001 and SOC 2 often require documented risk assessments. A matrix provides evidence that risks were evaluated.
Key Elements of a Risk Assessment Matrix
A well-designed risk matrix contains two primary axes:
- Probability (Likelihood): The chance that a risk event will occur. Scales range from rare to almost certain, often mapped to numerical values (e.g., 1–5). Consistency matters—define the scale early and use it across the project.
- Impact (Severity): How much the event would disrupt the project’s objectives if it happens. Impact scales can span from insignificant to critical.
Color-coded zones indicate risk levels: red for high risk (requires immediate action), yellow for medium risk (monitor and prepare contingencies), and green for low risk (track with minimal resources). Matrices often come in 3×3, 4×4, or 5×5 grids. Simpler grids promote clarity and support faster decision-making.
How to Build a Risk Assessment Matrix
Creating an effective risk matrix is a structured process. While many organizations offer templates, you can build your own using spreadsheet software. Follow these steps:
- Identify Risks: Brainstorm potential risks related to scope, schedule, budget, and quality. Engage stakeholders across disciplines to capture technical, operational, and strategic risks. Document each risk in a register.
- Define Probability and Impact Scales: Establish consistent scales for probability (e.g., rare, unlikely, possible, likely, almost certain) and impact (e.g., insignificant, minor, moderate, major, critical). Assign numerical values to these levels to enable scoring.
- Assess Risk Levels: Evaluate each risk for both probability and impact. Use historical data, expert judgment, and stakeholder interviews to assign ratings.
- Plot and Prioritize: Place each risk on the matrix according to its ratings. The resulting heatmap shows which risks fall into the red, yellow, or green zones. Color-blind users benefit when labels like “Low,” “Medium,” and “High” accompany the colors.
- Monitor and Update: A risk matrix is not static. Update it after major milestones, when new risks emerge, or when existing risks change. Regular reviews keep the matrix up to date and improve response times.
Risk Matrix Template
Let’s take a look at risk-assessment matrix templates.
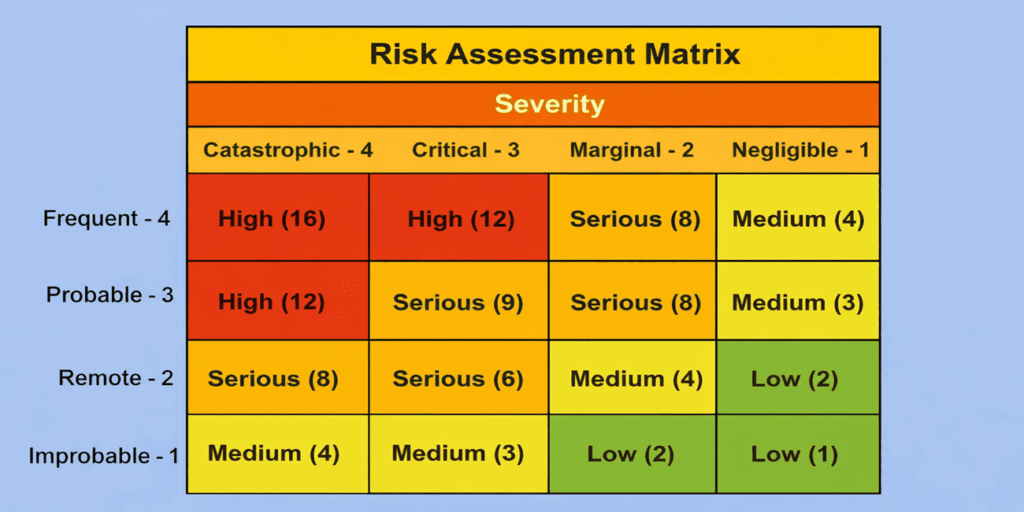
These templates categorize risks from low to high, with probabilities ranging from highly likely to very unlikely. The risk rating is determined by locating the intersection of these two criteria.
Below is an example of a 4×4 risk-assessment matrix template.
Practical Tips for Building Your Matrix
Use Consistent Scales: A 3×3 or 5×5 grid works well for most projects. Larger matrices may give a false sense of precision.
Tailor to your Industry: Construction teams might use terms such as negligible, moderate, and severe, while IT projects might focus on impacts on availability, confidentiality, and integrity. Customize definitions to match your risk tolerance.
Document Assumptions: Subjectivity is a key limitation of risk matrices. To mitigate bias, document why each risk received its probability and impact ratings and who provided the input.
Include Qualitative Data: Combining qualitative and quantitative information improves objectivity. Capture notes about root causes, triggers, and potential warning signs.
Advantages and Limitations of a Risk Assessment Matrix
Advantages
- Prioritization and Focus: The matrix highlights high-priority risks and helps teams allocate resources wisely.
- Visual Communication: Color-coded zones make it easier for stakeholders to grasp risk severity at a glance, improving buy-in and participation.
- Low Cost: A risk matrix is simple to create using common spreadsheet tools. It provides structure without requiring specialized software.
- Trends and Monitoring: Regularly updating the matrix makes emerging patterns visible, enabling early action.
Limitations
- Subjectivity: Assessments of probability and impact are based on human judgment, which can vary widely. Without careful calibration, the matrix may misrepresent risk severity.
- Simplification: Risk categories may lack the granularity needed for complex projects. A 3×3 grid may oversimplify a dynamic environment.
- Timing Sensitivity: The matrix does not account for when a risk will occur. A moderate risk that occurs during a critical project phase may have a greater impact than its level suggests.
- Incomplete Data: Poor quality or incomplete data can lead to inaccurate scores. This issue stresses the need for continuous data collection and validation.
Understanding these limitations can help you supplement the risk matrix with other techniques. Consider using a risk register to document detailed risk information; Monte Carlo simulations for quantitative analysis of schedule or cost risks; or decision trees to evaluate complex risk scenarios with multiple outcomes.
Real-World Example of Risk Matrix
Imagine a healthcare IT project to implement an electronic medical records system. The project team identifies risks, including hardware failure, regulatory noncompliance, and staff resistance to new technology.
They build a 5×5 risk matrix and assign probability and impact scores. Hardware failure is rated high probability and high impact, placing it in the red zone. Staff resistance is a moderate probability and moderate impact (yellow zone). Regulatory noncompliance is low-probability but high-impact (upper left), prompting careful monitoring and contingency planning.
This visualization helps the team decide where to allocate budget—for example, investing in backup systems and staff training while tracking regulatory changes through regular audits.
Tips for Effectively Using the Risk Assessment Matrix
- Align with Organizational Tolerance: Risk tolerance varies by organization. A start-up may accept higher technical risks than a hospital. Tailor the matrix thresholds to reflect your organization’s appetite for risk.
- Engage Stakeholders Early: Involve sponsors, team members, and subject-matter experts when defining scales and scoring. Collaborative scoring reduces bias and builds consensus.
- Combine with Other Methods: Use the matrix alongside qualitative techniques, such as interviews, or quantitative tools, such as simulations. This combination addresses the limitation of subjectivity.
- Document and Communicate: Keep a record of decisions and share the matrix widely. Transparent communication reduces mistrust and promotes shared ownership of risk responses.
FAQs
Q1. What is the difference between a risk matrix and a heat map?
A risk matrix is a structured grid showing probability versus impact scores, while a heat map is a broader visualization that may display risk severity or other metrics using color gradients. The terms are often used interchangeably, but a risk matrix focuses specifically on likelihood and impact.
Q2. How often should I update my risk matrix?
Update your matrix whenever there is a significant change—such as scope adjustments, emerging risks, or major milestones. Regular reviews (e.g., monthly or at each phase gate) ensure your risk picture stays current.
Q3. Can I use the same scales across all projects?
It’s better to tailor scales to each project’s context. A small marketing campaign may require only a 3×3 matrix, while a complex infrastructure project may require a 5×5 grid with custom definitions.
Q4. Does the risk matrix eliminate the need for quantitative analysis?
No. A risk matrix is a qualitative tool. For high-impact decisions, complement it with quantitative techniques such as Monte Carlo simulation or expected monetary value analysis to estimate potential cost and schedule impacts.
Q5. What’s the difference between a 3×3 and a 5×5 risk matrix?
A 3×3 matrix (low/medium/high for both probability and impact) offers simplicity and faster decision-making, ideal for smaller projects. A 5×5 matrix provides greater granularity, with five levels per axis (e.g., rare/unlikely/possible/likely/almost certain), making it better suited to complex projects that require detailed risk differentiation.
Q6. How do I score risks in a risk matrix?
Multiply the numerical values assigned to probability and impact. For example, if “likely” = 4 and “major impact” = 4, the risk score is 16. This numerical scoring helps prioritize risks within the same color zone and track changes over time.
Summary
A risk assessment matrix is a simple and effective tool for managing project risks. It helps teams compare risks based on their likelihood and potential impact. By using clear levels and color-coded zones, teams can quickly identify which risks require action first. This approach supports better planning, smarter resource use, and stronger decision-making throughout the project lifecycle.
Further Reading:
- What is Risk Management?
- A Short Guide to Project Risk-Management Plans
- Risk Vs Issues in Project Management
- Risk Register: Definition and Example
- Risk Analysis: Definition, Types, and Examples
References:
- What is the Risk-Assessment Matrix?
- Internal Audit in Focus
- Risk Management Toolkit
- Qualitative Risk Assessment
This topic is important from a PMP and PMI-RMP exam point of view.

I am Mohammad Fahad Usmani, B.E. PMP, PMI-RMP. I have been blogging on project management topics since 2011. To date, thousands of professionals have passed the PMP exam using my resources.


Good explanation !
Thank you for the brief-yet-thorough explanation, Fahad. Really helpful.
Best of luck!