Today, I will provide the seven best online flowchart software platforms and diagramming tools.
Frank and Lillian Gilbreth developed the flowchart concept in 1921. They used it to display details of a project’s process and task dependency.
You can draw a flowchart easily for a simple process requiring a few steps. However, it quickly becomes complex as the number of processes increases. In this case, using a flowchart software program to draw flow charts would be best.
These tools allow you to draw, edit, and share flowcharts with a few mouse clicks.
If you are looking for an online flowchart software platform, you can review the options discussed in this post and select the one best suited to your requirements. All these software platforms are renowned and provide many features to draw interactive flowcharts.
What Is Flowchart Software?
A flowchart is a diagram that visually displays the steps in a process using different shapes. Flowchart software is a platform that can create a sequence diagram of interconnected shapes that sketches a plan or idea’s flow, hierarchy, order, or structure.
They can range from simple charts to diagrams with multiple routes.
A few key features of these diagramming tools are as follows:
- Drag-and-Drop Interface: Allows users to add and arrange flowchart elements easily.
- Predefined Templates and Symbols: Offers a variety of standard shapes and templates for different types of flowcharts.
- Customization Options: Provides tools to customize the appearance of flowchart elements, including colors, sizes, and labels.
- Collaboration Tools: Enables multiple users to work on the same flowchart and share feedback simultaneously.
- Export and Sharing Options: These tools allow users to export and share flowcharts in various formats (PDF, PNG, etc.).
Basic Flowchart Symbols
A flow chart can have many symbols, such as ovals, arrows, parallelograms, rectangles, and diamonds.
An oval shape depicts the start or end of the chart; an arrow (or line) shows a connection, relationship, or pathway; a parallelogram symbolizes input or output; a rectangle stands for a process; and a diamond signifies a decision that needs to be made.
Common Types of Flowcharts
Flowcharts have many names, such as Process Flowchart, Process Map, Functional Flowchart, Business Process Mapping, Business Process Modeling, and Notation or Process Flow Diagram. Three popular examples of flowcharts are Process Flowcharts, Data Flowcharts, and Business Process Modeling Diagrams.
Some other types of flowcharts are Swimlane Flowchart, EPC Diagram, SDL Diagram, Cross-Functional Flowchart (or Deployment Flowchart), and IDEF Flowchart. They are also coupled with famous diagrams, such as Data Flow Diagrams (DFDs) and Unified Modeling Language (UML) Activity Diagrams.
Why Should We Use Flowcharts?
All businesses strive to improve workplace efficiency, and a process map can help them achieve this objective. A process map can find bottlenecks in processes and help streamline them. Streamlining processes will help the team increase productivity, which means more sales.
Flowcharts aims to communicate how a process works without confusing it with any technical jargon. They are extensively used to improve and communicate complicated processes visually to stakeholders.
Flow charts can help organizations immensely improve their processes.
A few uses of flowcharts are:
- Flowcharts help develop plans, business process documentation, and training materials.
- They help analyze business waste and inefficiency.
- In the form of decision trees, they are used as a step-by-step guide to solve a problem.
Flowcharts are commonly used in all fields by professionals and non-technical people.
I have tried many project management software and task management tools, such as Wrike and monday.com, but none of them has a feature to draw a flow chart. If you need to draw a flow chart or a process map, you will need to use a standalone flowchart software tool.
Best Flowchart Software and Diagramming Tools
Below are a few top flowchart software and diagramming tools:
- Lucidchart
- Microsoft Visio
- Draw.io
- SmartDraw
- OmniGraffle
- Cacoo (Web) OR Textografo (Web)
- Google Drawings
1. Lucidchart
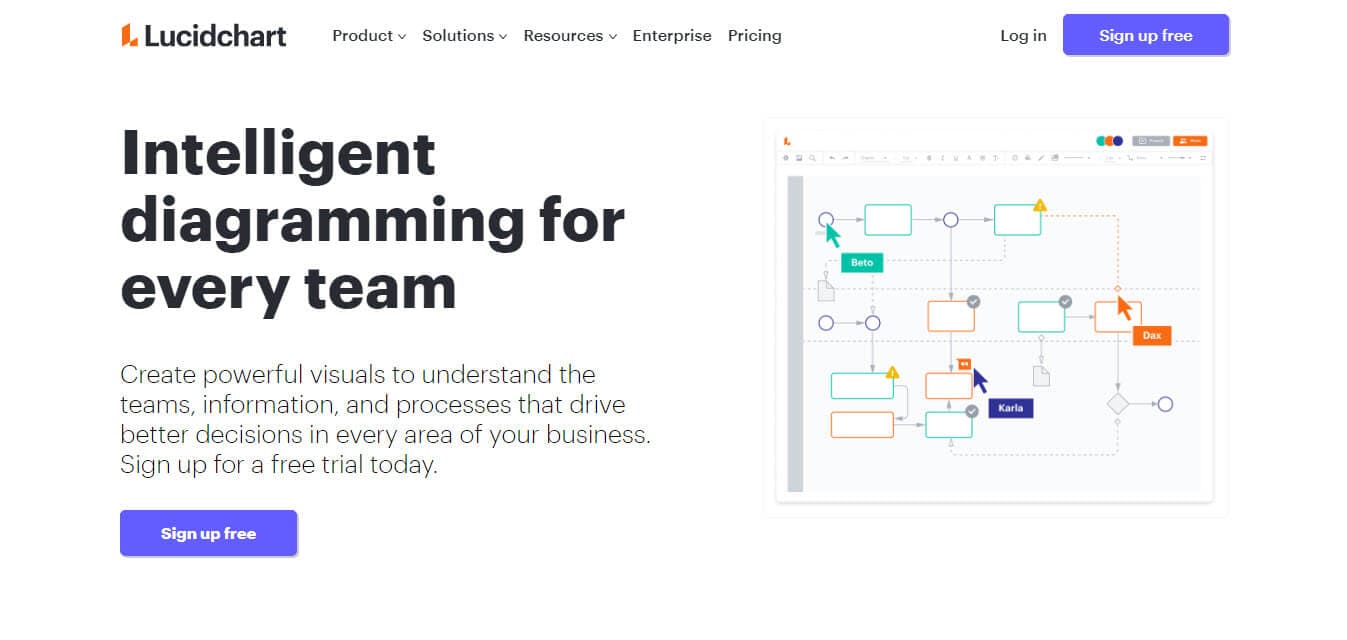
Lucidchart is a visual collaboration suite; it facilitates discussions by writing and sketching ideas on a shared space resembling a whiteboard. Multiple stakeholders can work and collaborate on it from different places.
With intelligent diagramming and cloud visualization, you can plan by combining ideas from different stakeholders.
Lucidchart operates on browsers that support HTML5 and does not require third-party software like Adobe Flash.
It authorizes the team to collaborate on flowcharts, ERDs, BPMN, wireframes, mockups, network diagrams, org charts, and other visuals in real time.
Lucidchart integrates with G Suite, Google Drive, Microsoft Office, Microsoft Teams, Salesforce, Confluence, Jira, and more.
Key Features of Lucidchart
- Create neat and clean diagrams
- Works faster with keyboard shortcuts
- Flowcharts can be published in PDF, JPG, PNG
- Easy import and export of flow diagrams
- Expand your canvas for more space.
- Use toggles, layers, and links for clarity.
- Link to external sites or documents.
- Create slide presentations from diagrams.
Lucidchart ai features
- Supercharge workflow with AI in Lucid.
- ChatGPT+ auto-generates editable diagrams.
- AI Prompt Flow interacts with language models.
- Cut busywork, enhance creativity, and integrate seamlessly.
Lucidchart Pros
- No installation is required to use Lucidchart
- Easy to integrate with the Google suite
- An intuitive interface allows you to get started quickly
Lucidchart Cons
- Integration with the Microsoft software suite can be a hurdle
- Printing is challenging, given the export process
- The sharing option should be improved
- Pricing is not transparent
Lucidchart Pricing Plans
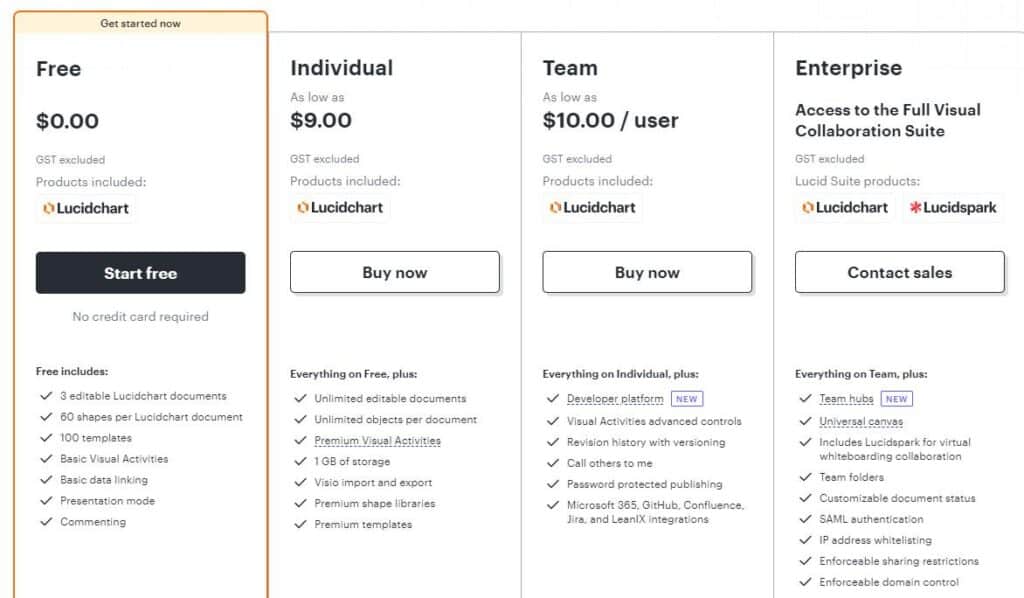
Lucidchart has four pricing plans:
- Free: The free plan allows editing three documents and offers basic collaboration and integration.
- Individual: The price is 9.00 USD per month. You can edit unlimited documents with over 1,000 pre-built templates.
- Team: The pricing is 10.00/user/USD per month. You will get advanced collaboration and basic automation.
- Enterprise: The pricing for this plan is not given on the site, and you must contact customer support for a pricing plan.
Lucid has four bundled with pricing as follows.
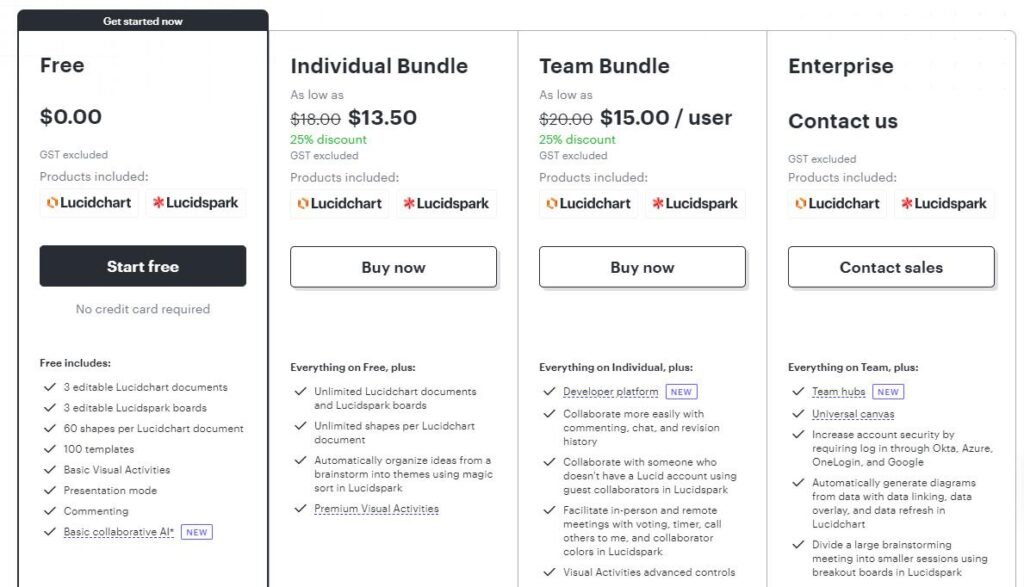
- Free: The free plan includes 3 Lucidchart documents, 3 Lucidspark boards, 60 shapes per document, and 100 templates.
- Individual Bundle: Unlimited documents and shapes, magic sort for brainstorming, and premium visual activities for $13.50/month (25% off).
- Team Bundle: All Individual features plus developer platform, enhanced collaboration tools, guest collaborators, and advanced meeting facilitation for $15/user/month (25% off).
- Enterprise: All Team features plus team hubs, universal canvas, enhanced security, data-driven diagrams, breakout boards, and additional integrations. Contact for pricing.
2. Microsoft Visio

Microsoft Visio is a diagramming and vector graphics application for the Microsoft Office family. It was first introduced in 1992 and developed by Shapeware Corporation (in November 1995, Shapeware changed its name to Visio). Jeremy Jaech and Dave Walter were Aldus’s founders, and Ted Johnson was the lead developer. Microsoft acquired it in 2000.
Microsoft Visio is a diagramming tool for creating flowcharts, which assist in data visualization and process modeling. Visio also helps create organizational charts, floor plans, pivot diagrams, and others.
Visio does not have a Mac version.
Key Features of Microsoft Visio
- Easy conversion of Excel process map data into Visio diagrams
- Effortlessly create professional diagrams
- Collaborate with others and share diagrams seamlessly
- Simple, highly secure sharing
- Integrate with Microsoft 365 apps.
- Ensure enterprise-grade security.
Microsoft Visio AI features
- Generate AI images with DALL-E in Microsoft Edge.
- Provide a text prompt to create matching images.
Microsoft Visio Pros
- Preparing flowcharts is easy
- The predefined template helps in creating use case diagrams seamlessly
- It provides the ability to work offline and on cloud support
- It has an enhanced and large number of icons or symbols for workflows
Microsoft Visio Cons
- The desktop application is not available for Mac and Linux users
- Lacks artistic design-based suggestions
- Printing or publishing diagrams is not easy
- Not available as part of an Office subscription
Microsoft Visio Pricing Plans
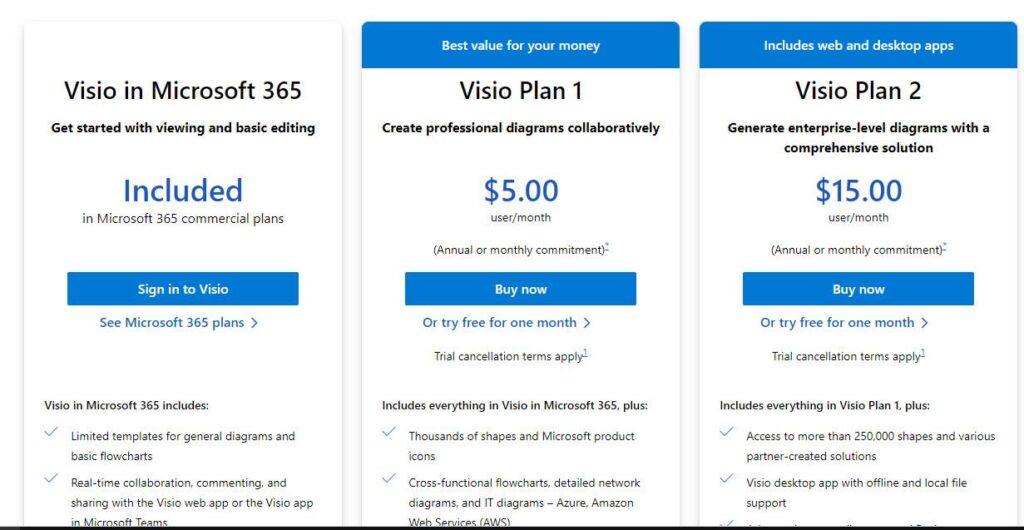
There are two plans available here. The first plan is $5.00 per month, and the second is $15.00 per month.
One-time Purchase plans
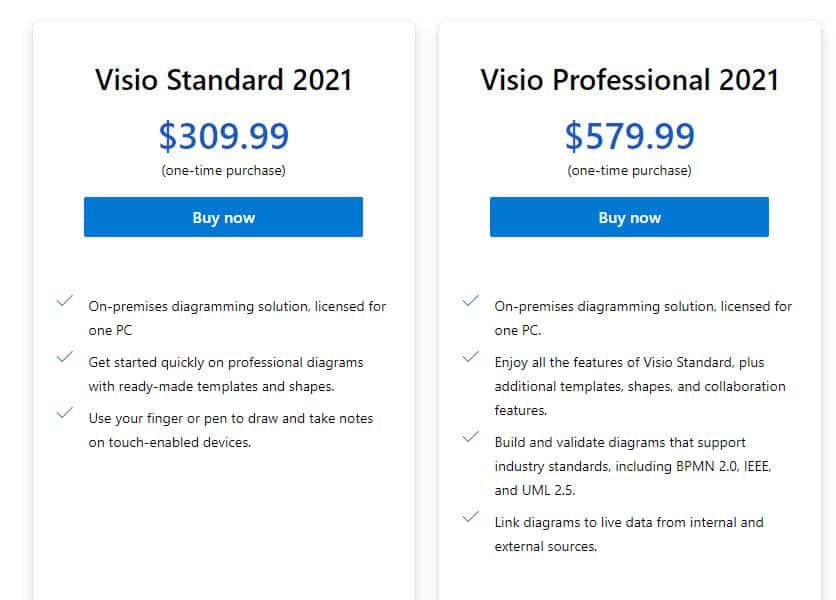
- Visio Standard 2021: $309.99, one-time purchase, ready-made templates, touch-enabled.
- Visio Professional 2021: This is a one-time purchase of $579.99, and it includes Standard features, extra templates, collaboration, standards support, and live data linking.
3. Draw.io
Gaudenz Alde founded Draw.io, an Atlassian ecosystem diagramming plugin for Confluence and Jira. Seibert Media, a German consultancy specializing in Atlassian and Google Cloud, owns the plug-in.
Draw.io is much more powerful and versatile and can help create diagrams for:
- BPMN
- UML
- ER
- Org charts
- Networks (AWS, Azure, Cisco, Citrix, GCP, IBM, etc.)
- Mockups and Wireframes
- Floor plans
- Infographics
- Mind Maps
It is responsive and works on mobile devices.
It is a cloud-based online tool integrated with G Suite/Google Drive and Dropbox. Users can create diagrams offline and save them locally using draw.io’s desktop app for macOS, Windows, and Linux.
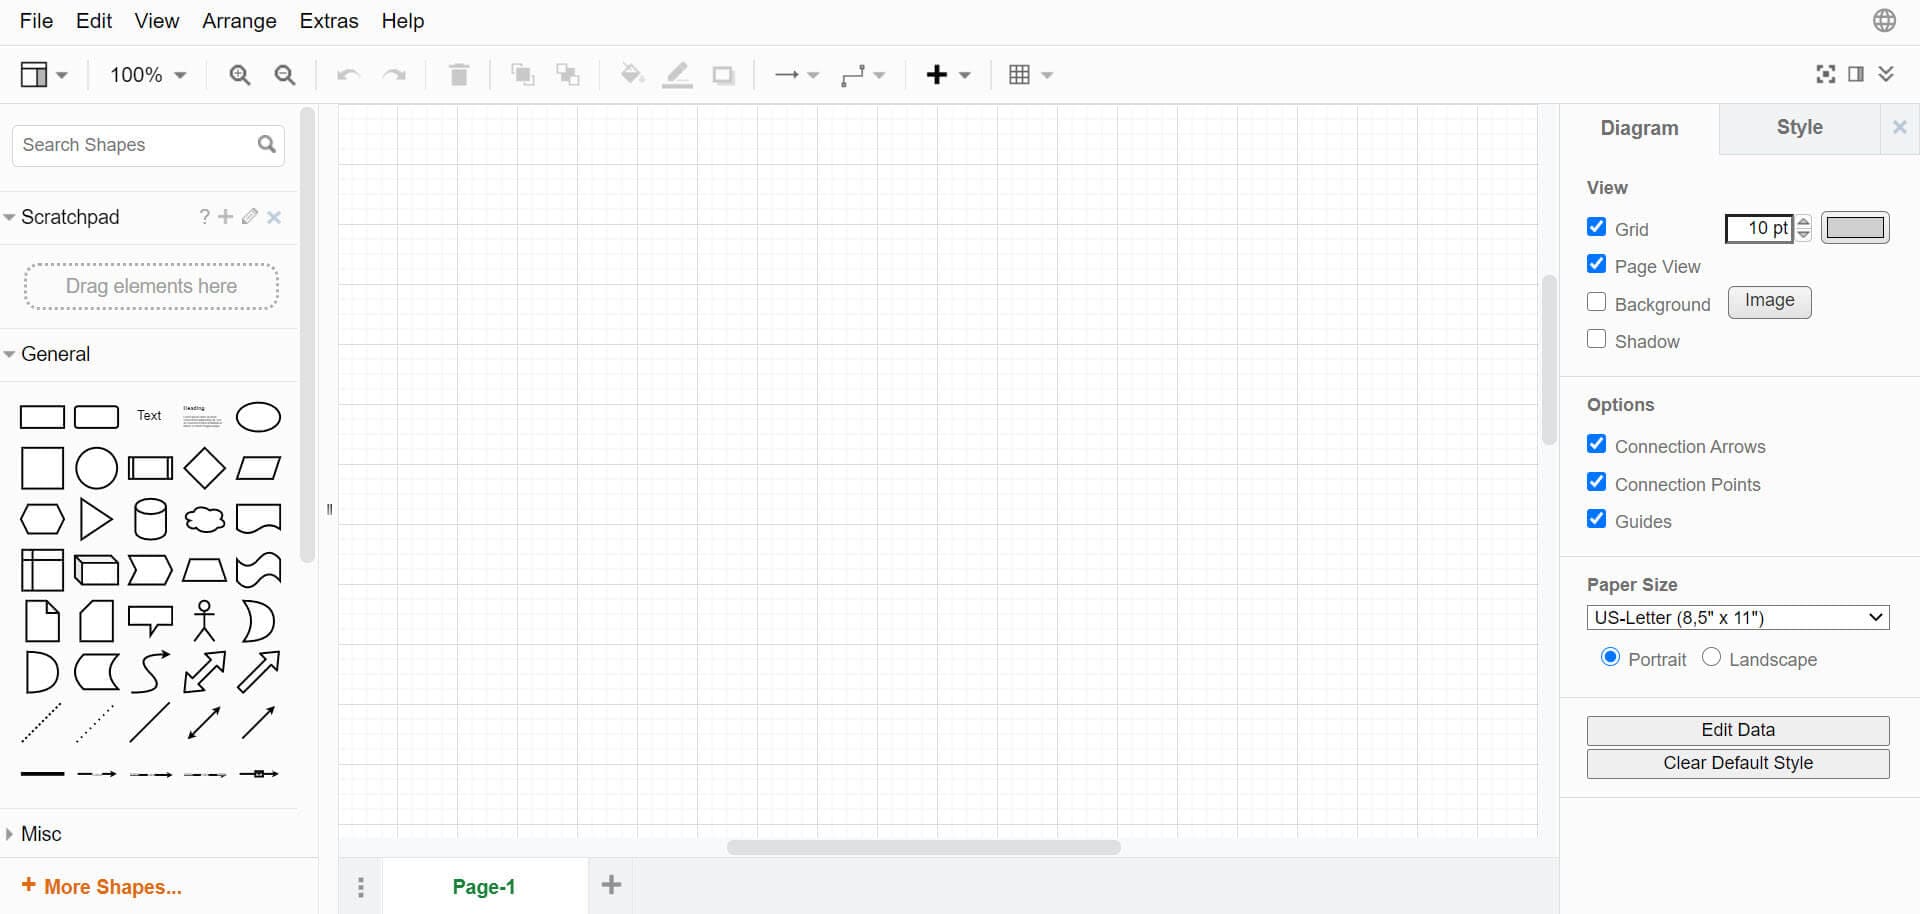
It provides an intuitive interface with drag-and-drop functionality, customizable diagram templates, and an extensive shape library. Users can create and edit various diagrams, including flowcharts, org charts, process diagrams, ER diagrams, UML, and network diagrams.
Key Features of Draw.io
- Free
- Drag and drop functionality
- Text to chart
- Mind map
- Process map
- Real-time collaboration for multiple users.
- Integrate with Confluence, Google Drive, and Dropbox.
- Export as images or PDFs, share via link or embed.
- Template library for common diagrams.
Draw.io Draw.io Pros
- Makes flowcharting easy
- Helps in importing and exporting data
- Allows multiple users to work on one project to ensure effective teamwork
Draw.io Cons
- The app lags and becomes slow if used for a while
- Exporting the diagrams is challenging
- Lacks a few customization tools needed for diagram elaboration
Draw.io Confluence Pricing Plans
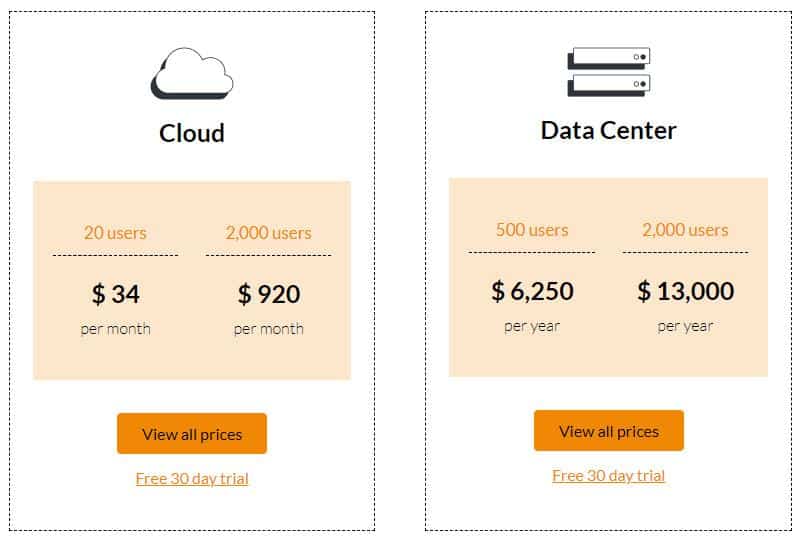
The prices listed are examples. Visit the Atlassian Marketplace for more pricing options based on your team size.
4. SmartDraw
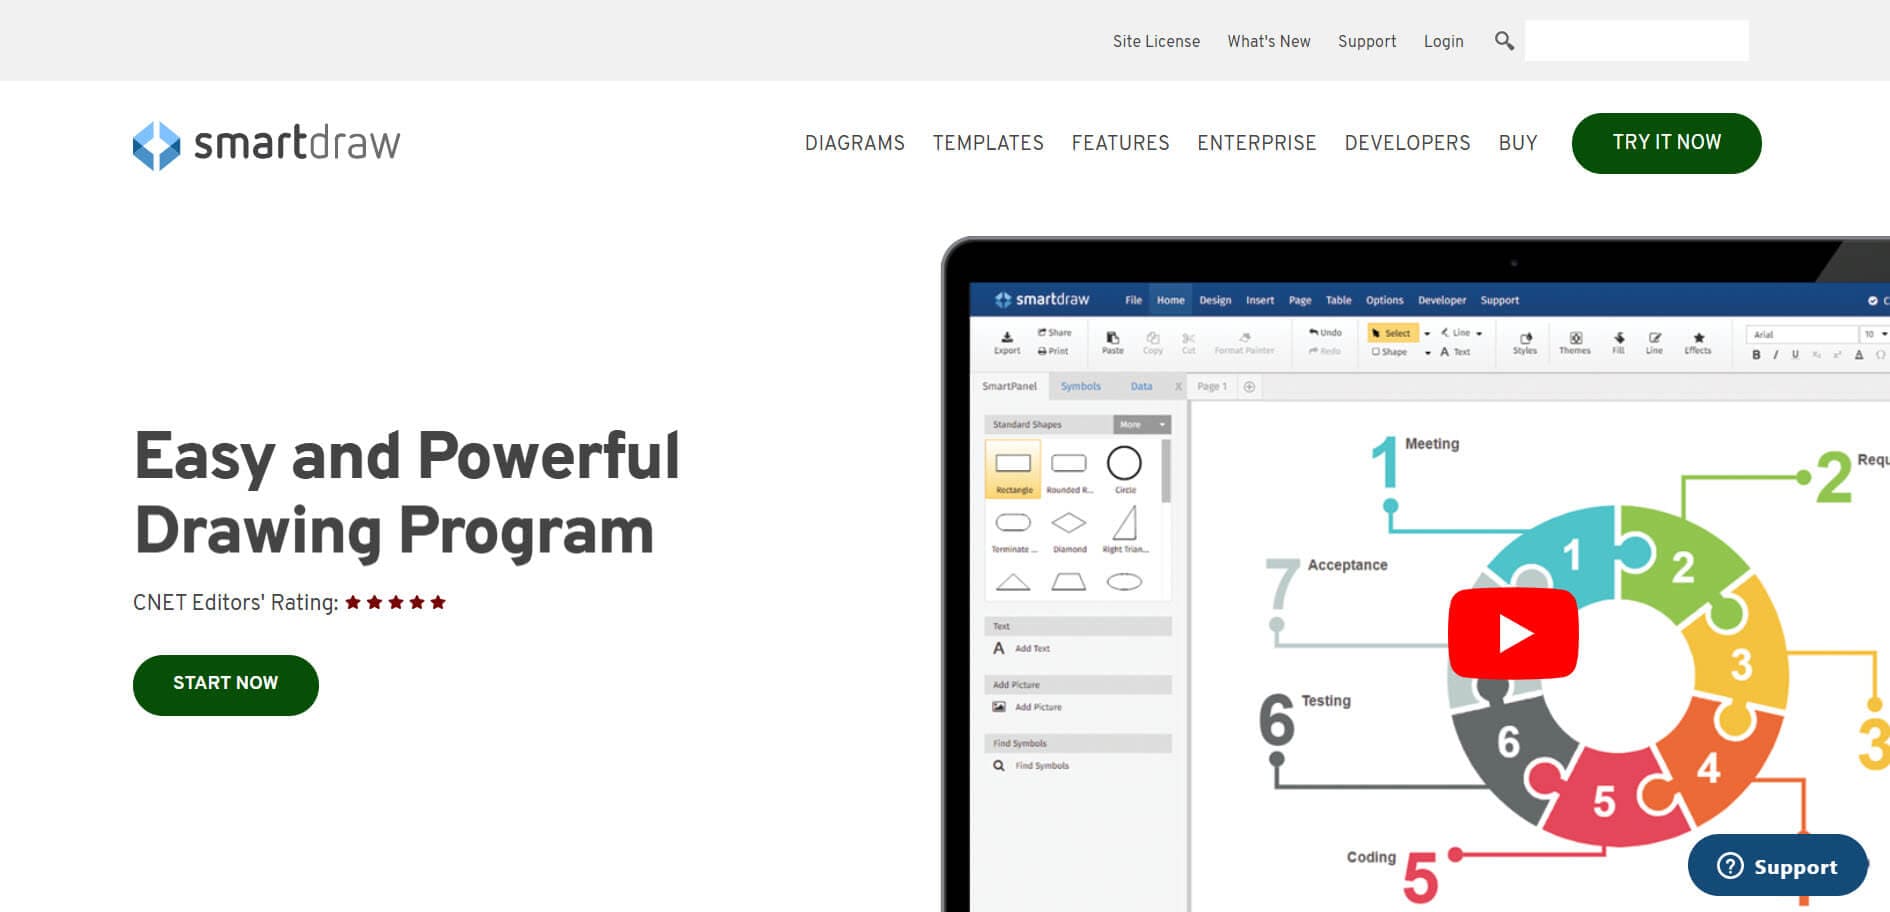
Paul Stannard founded SmartDraw in 1994. SmartDraw helps you draw all sorts of flowcharts.
With SmartDraw, you can create calendars, decision trees, floor plans, forms, maps, network diagrams, organizational charts, project charts, etc.
Organization and structure charts can be created in minutes using SmartDraw’s built-in templates, tools, and symbols. You can export flowcharts in Excel, PDF, HTML, image formats, etc. SmartDraw assists anyone who wants to make a diagram and become more effective.
Coca-Cola Beverages, Hewlett-Packard, Nike, Nortech, Kent State University, and the US Department of Justice are well-known users of SmartDraw.
Key Features of SmartDraw
- Intuitive drag-and-drop interface
- Auto-adjusted feature adjusts shapes automatically
- Seamless third-party integration
- Available in 100 languages
- Intuitive flowchart maker with 70+ templates
- Library with 34,000+ icons
- Export to PDF, PNG, JPEG, and more
- Integrates with Visio, Confluence, Google Workspace, and Slack
SmartDraw Pros
- Easy to create beautiful flowcharts
- Great export capability
- Useful quick access toolbar
SmartDraw Cons
- Too complex for larger projects
- Inflexible during the changes made in views
SmartDraw Pricing Plans
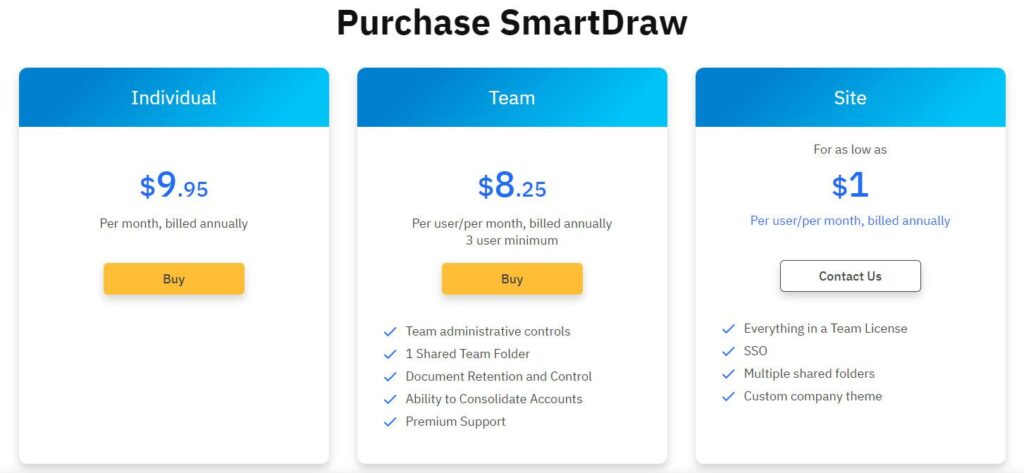
SmartDraw pricing plans:
- Individual: $9.95/month, billed annually
- Team: $8.25/user/month, billed annually, the 3-user minimum required.
- Site: It is as low as $1 per user/month and is billed annually.
5. OmniGraffle
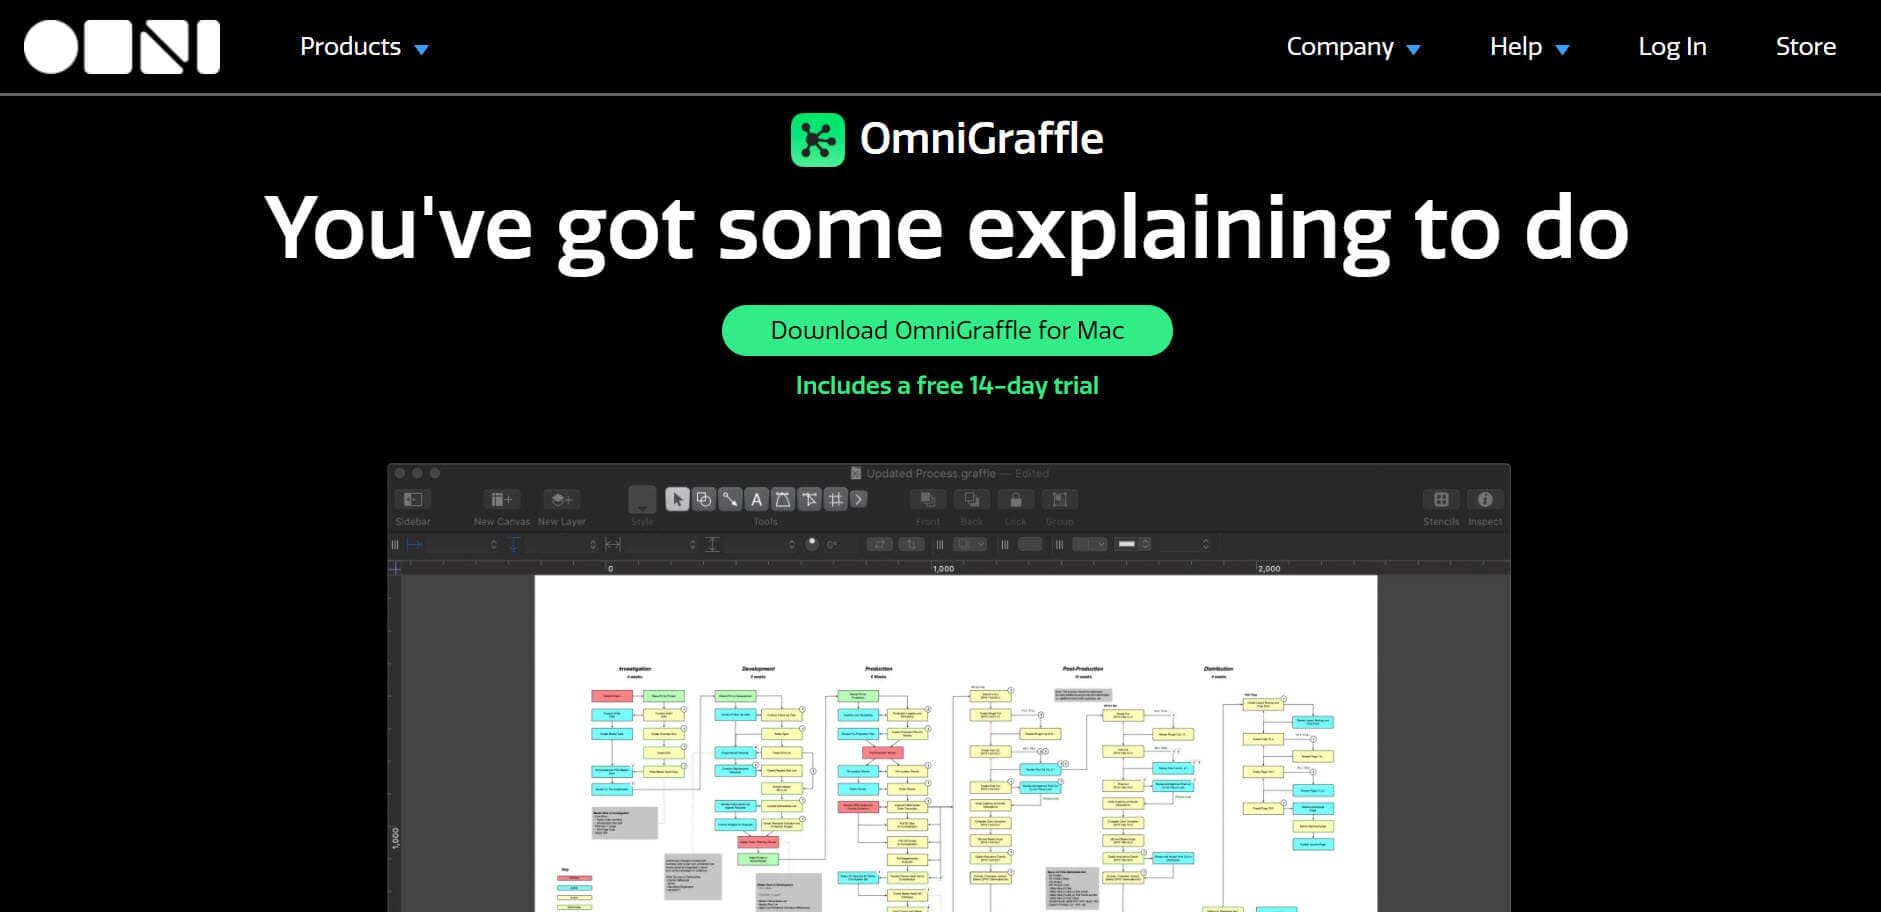
OmniGraffle is a diagramming application designed for Apple products. You can download it on your device and use it offline. It is a flexible tool for creating mockups for software and websites.
It provides many pre-designed templates to quickly mock-up a landscaping project or create an electrical diagram.
OmniGraffle was made for professionals who need to organize or communicate visually beautiful mockups.
Key Features of OmniGraffle
- Export layered OmniGraffle files like Adobe Photoshop files (.psd)
- AppleScript support
- Create tables and subgraphs
- Work with multiple editing windows open
- Advanced drawing tools for precise designs.
- Support for multiple file formats.
- Automation and scripting for efficiency.
- Professional templates for various uses.
- Sleek presentation mode with interactive elements.
OmniGraffle Pros
- It is easy to use
- A vast collection of features allows the creation of powerful documents
- The interface is clean, and the software is reliable
- A powerful tool for UML and other diagram conventions
OmniGraffle Cons
- Steep learning curve
- Lacks real-time collaboration
OmniGraffle Pricing Plans
OmniGraffle pricing is available in the following plans:
Buy for Mac
OmniGraffle is available in Pro and Standard versions.
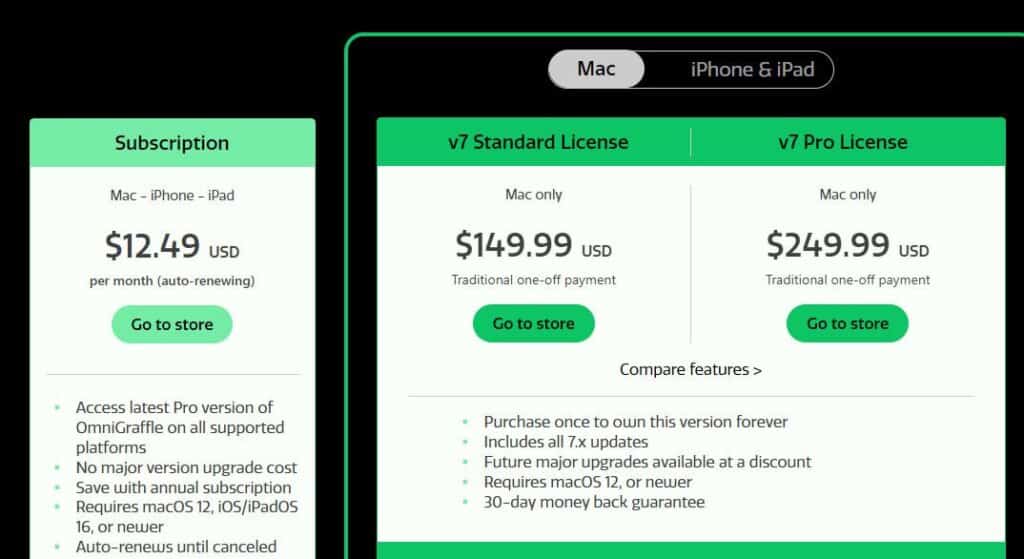
- Pro: $249.99
- Standard:$149.99
Buy for iOS and iPad
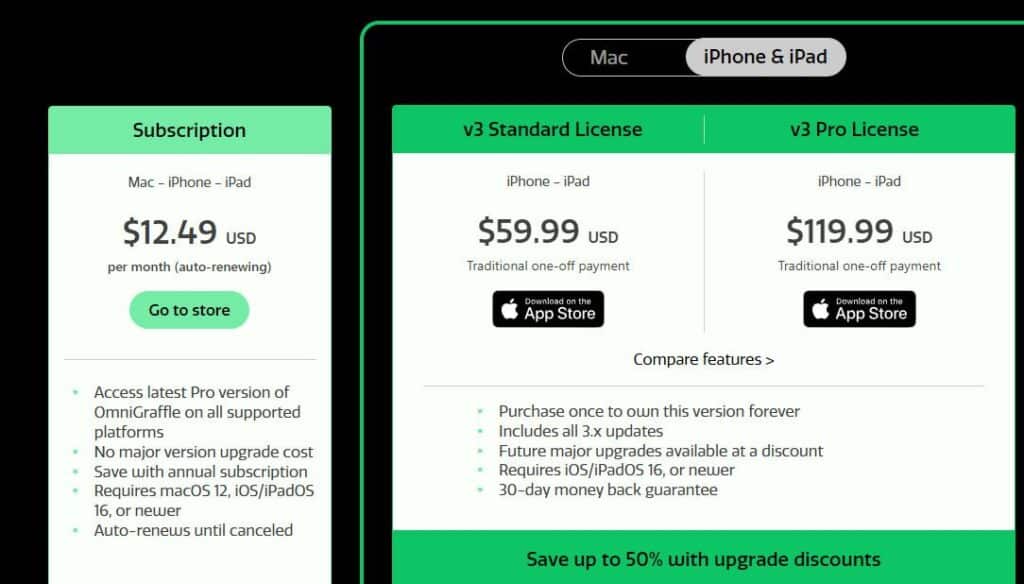
- Pro: $119.99
- Standard: $59.99
6. textografo (Web)
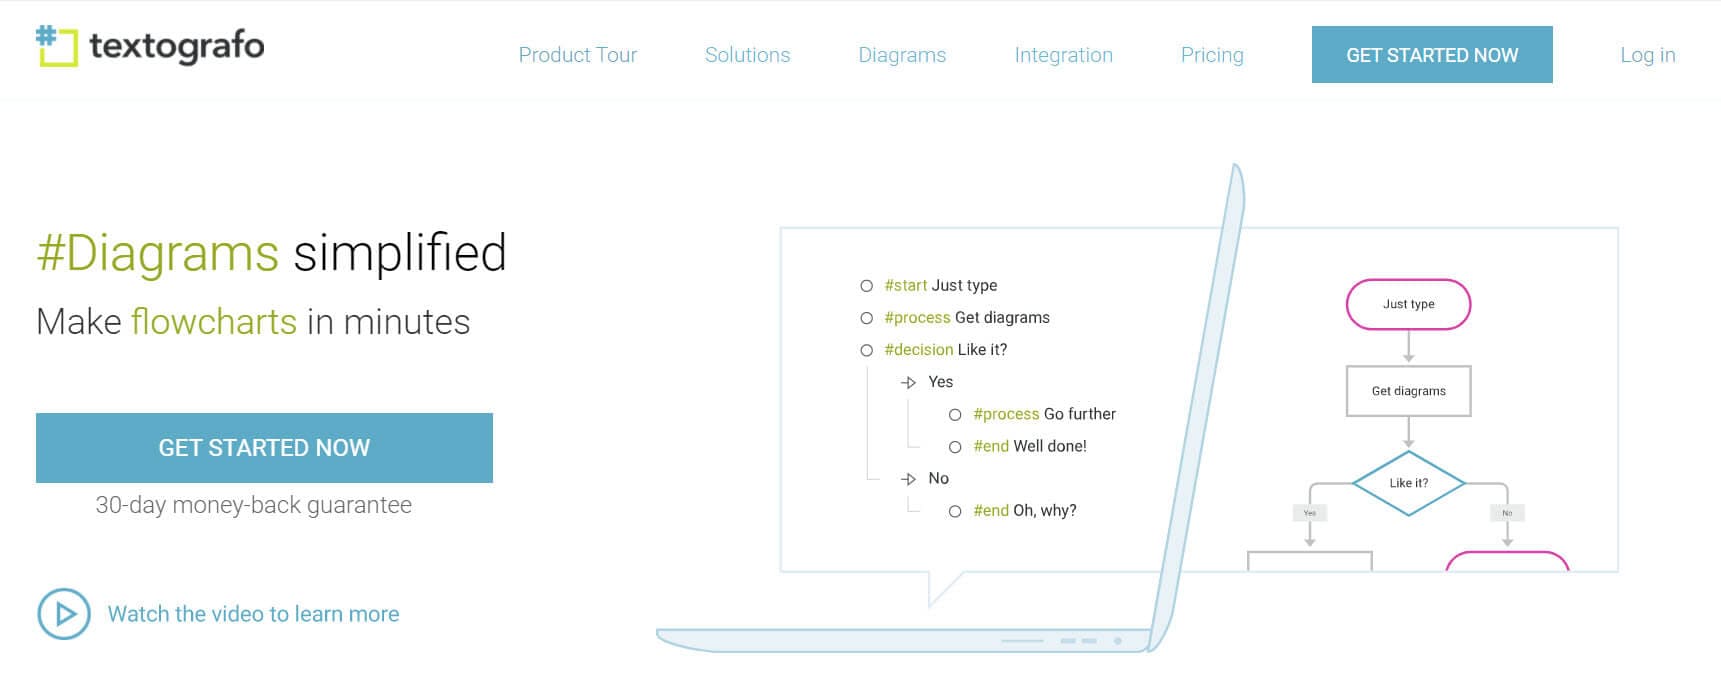
Julien Andrieu founded Textografo in 2015, and the company is located in Barcelona, Spain. It is a cloud-based diagramming tool that lets users draw diagrams like flowcharts, mind maps, organizational charts, decision trees, etc.
You can create an animated diagram with Textografo to communicate the message better. It is an online diagramming application tool used in over 80 countries by organizations of all sizes.
Simple textual syntax makes creating, updating, and collaborating on diagrams like flowcharts, mind maps, decision trees, organizational charts, and site maps easy. With Textografo, you can design diagrams quickly. It is easy to take notes and then convert them into professional-looking diagrams.
Textografo is used in every industry to design new processes and software. It is used widely by product managers, business analysts, UX designers, developers, consultants, and managers.
Key Features of Textografo
- Diagram automatically generated from text
- Display the diagram step by step in one click
- Basic and cross-functional flowcharts
- Download as PNG and PDF
- Professional-looking themes
Textografo Pros
- It is elegantly easy and user friendly
- The software uses a text-to-diagram framework that users can immediately learn
- Textografo’s creators offer a free trial that requires no credit card
Textografo Cons
- No mobile app
- 24-hour support response
- It only supports two software integrations
Textografo Pricing Plans
Textografo has two pricing plans:
- Essentials: The price is 5 USD per month, but changes to 4 USD per month if you pay annually.
- Premium: The price is 19 USD per month but changes to 14 USD per month if you pay annually.
7. Google Drawings
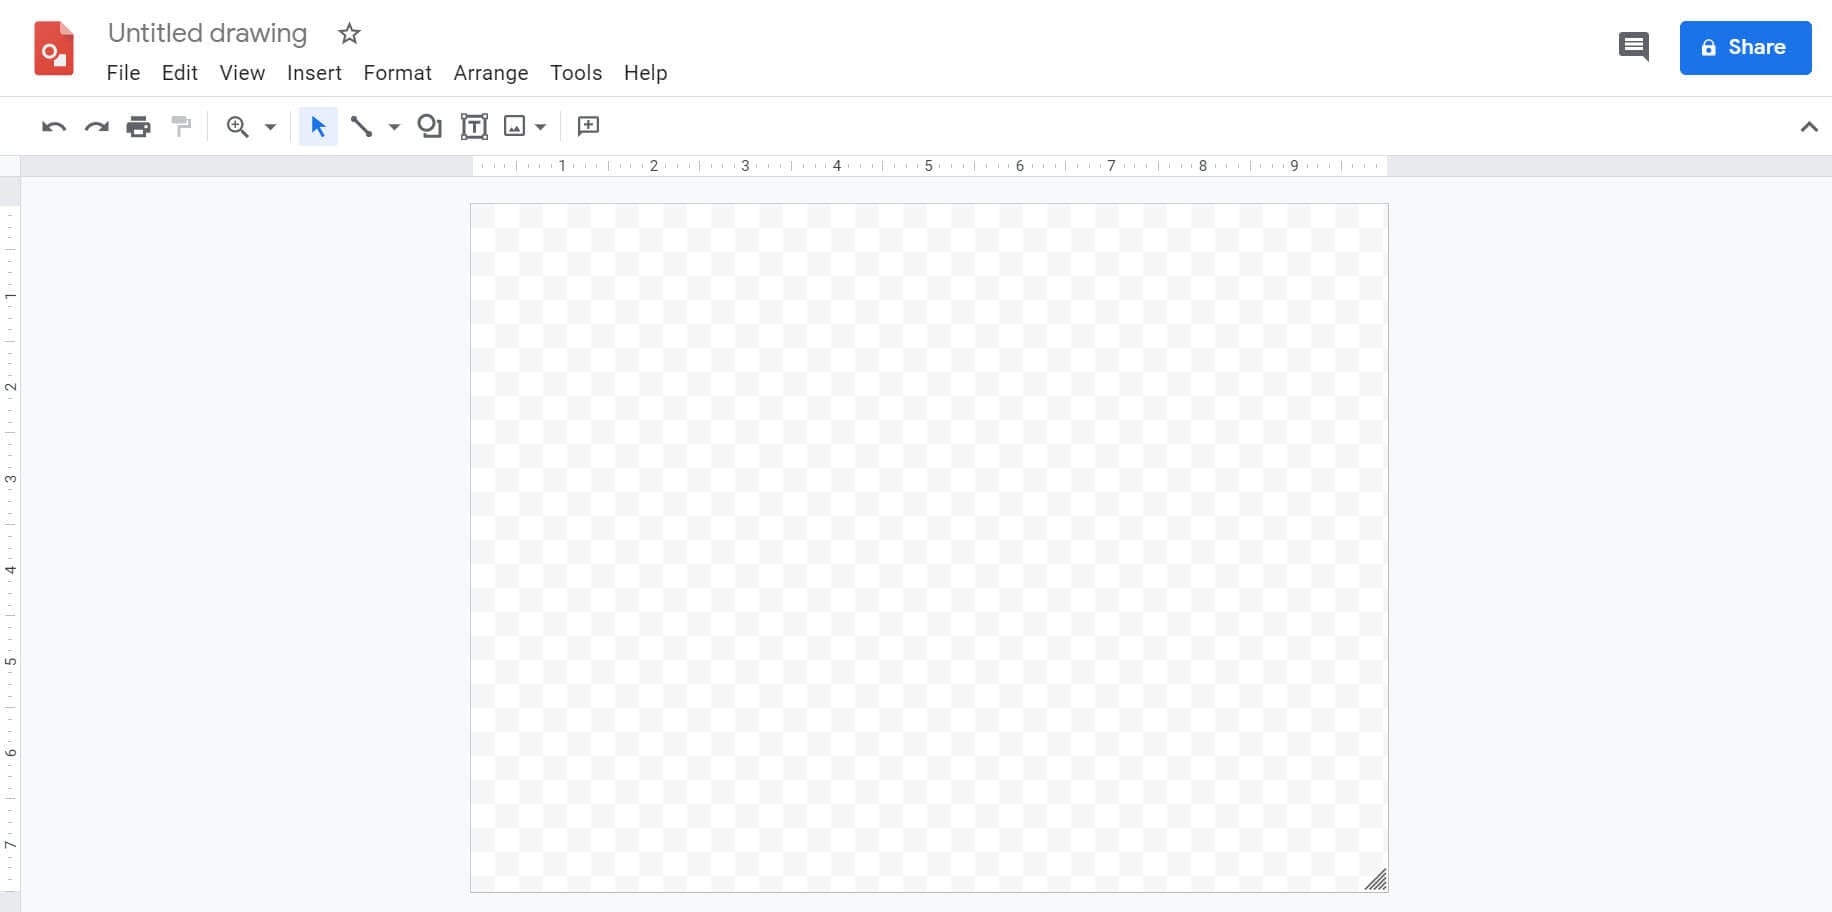
Google Drawings was introduced on April 12, 2020. It is a diagramming software tool combined as part of the free, web-based Google Docs Editors suite offered by Google. Google Drawings is a web and desktop application on Google’s Chrome OS.
The app allows users to create and edit flowcharts, organizational charts, mind maps, website wireframes, concept maps, and other diagrams online while collaborating with other users in real time.
Google Drawings is similar to a digital poster board — or a big digital piece of paper. It is a virtual board that lets users generate content by drawing, pasting images, linking videos and websites, and embedding text, shapes, tables, and other content onto a Google Drive page. Users can create concept maps, flow charts, diagrams, visual storyboards, and original art.
This app is freely available to anyone with a Google account. Users can collaborate on the same drawing simultaneously, and students can collaborate on similar drawings from various computers at different locations. You can share drawings via a link or insert them into a webpage (by selecting “Publish to the web” in the File menu).
Key Features of Google Drawings
- Create images, diagrams, charts, prototype drawings, and rough layouts
- Consolidate images from outside of Google Drawings
- Include drawing into documents, spreadsheets, presentations, interactive whiteboards, or other digital media
- Show work on a math problem
- Create timelines, infographics, and logos
- Incorporate text into label a drawing or stylize text to enhance a document
- Collaborative brainstorming
- Use It for Collaborative Post-It
Google Drawings Pros
- Free
- Ease of use
- Collaboration with other Google users
- Finished projects in different formats can be easily downloaded or inserted into another Google app.
- Users can connect from many different devices and view/edit the drawing in real-time
Google Drawings Cons
- Limited features are available
- Users must have a Google email account
Google Drawings Pricing Plans
A free version is available.
What important feature should I consider when selecting a Diagram or Flowchart software?
When choosing diagram software, several important features should be considered to ensure it meets your needs and preferences. Here are some key factors to keep in mind:
- Ease of Use: The software should have a clear, intuitive user interface that can make the software easier to learn and use. It should have a drag-and-drop functionality to simplify creating and arranging flowchart elements.
- Templates and Symbols: It should offer predefined templates to help you get started quickly. It should also include standard symbols and shapes that you can use in your flowchart.
- Customization Options: It should be able to customize colors, fonts, sizes, and shapes of flowchart elements. You should be able to add and format text, notes, and annotations.
- Cloud-Based Vs Desktop Software: Cloud-based software can be accessed from anywhere with an internet connection, while desktop software can be used offline. Cloud-based solutions often provide automatic syncing and cloud storage.
- Advanced Features: Automation features like auto-arrange or auto-connect can save time. It should offer version control to track changes and allow you to revert to previous versions. It should support interactive elements such as hyperlinks, clickable elements, and other interactive features.
- Pricing: Consider whether free versions or trials are sufficient for your needs or if paid versions offer necessary advanced features. See if it offers a subscription or a one-time purchase. Evaluate the pricing model based on your budget and usage requirements.
Benefits of Using a Flowchart Software or Diagramming Tools
A flowchart software offers the following benefits::
- Improved Visualization: Flowchart software helps create clear and precise visual representations of processes, making complex information easier to understand. They Ensure uniformity in the presentation of processes, which is essential for standardization.
- Increased Efficiency: Automated features like drag-and-drop, pre-built templates, and auto-alignment save time compared to manual drawing. Flowchart software reduces the chances of errors by providing standardized symbols and structures.
- Enhanced Communication: Flowcharts make it easier to explain processes to stakeholders, team members, or clients, regardless of their technical background. Visual aids are often more engaging and easier to remember than text descriptions.
- Better Process Analysis: This tool helps identify inefficiencies and bottlenecks in processes. It also facilitates analyzing and improving existing processes by clearly mapping out each step.
- Collaboration and Teamwork: They enable multiple users to work on the same flowchart simultaneously, improving teamwork and coordination. They also help team members to leave comments and suggestions directly on the flowchart.
- Documentation and Training: Creates standardized documentation for processes, which is useful for training and onboarding new employees. Provides clear visual aids that can be used in training sessions to help new hires understand workflows and procedures quickly.
- Cost-Effective: Flowchart software can lead to long-term cost savings by improving process efficiency and reducing errors.
Conclusion
Flow charts are important in planning, designing, mind mapping, and other business aspects. If you are looking for the best online flowchart software, I recommend you review the software discussed in this blog post and select the one that best suits your requirements.

I am Mohammad Fahad Usmani, B.E. PMP, PMI-RMP. I have been blogging on project management topics since 2011. To date, thousands of professionals have passed the PMP exam using my resources.