
The Gantt chart, a type of bar chart, is the most important tool in schedule management. Project managers can use a Gantt chart to create timetables to manage and control project tasks and baselines. In addition, it is simple to understand and communicate with stakeholders because it is a graphical tool.
This blog post will discuss the Gant chart in-depth, with examples and templates.
What is a Gantt Chart?
Many believe Henry Gantt invented the Gantt chart, which bears his name. However, this is not the case.
In mid-1890, a Polish engineer named Karol Adamiecki invented the Gantt chart. He dubbed this bar chart a harmonogram, but it was only known in Poland and Russia. Henry Gantt, an American engineer, had the same idea and developed the Gantt chart for his production work to track progress fifteen years later.
It became popular in Western countries and is therefore known as the Gantt chart after Henry Gantt.
Definition: A Gantt chart is a bar chart that visually shows project tasks and the schedule. The tasks are shown on the vertical axis, while the task duration is shown on the horizontal axis. The graphic depicts the start and end dates of the activities, as well as the task dependencies and current schedule status.
These charts are simple to read and are frequently used in projects that require a graphical depiction of the schedule. The Gantt chart has evolved; it now displays the numerous project management dependencies between activities and schedule status.
Gantt charts assist project managers in tracking time, cost, scope, and project activities until the project is completed.
Types of Gantt Charts
Gantt chart can be of two types:
- Progress Gantt Chart
- Linked Gantt Chart
Progress Gantt Chart
These charts show the completed work in the shaded portion. If a job is 30% complete, the shaded area in the Gantt chart will be 30%, starting from the left of the activity.
When the chart is constructed, a vertical line depicts the time index, and you may compare the projected and actual progress. If you’re on the right track, the left side of the line will be shaded, and the right side will be blank.
This way, you can see your progress visually.
Linked Gantt Chart
Using lines, the Linked Gantt chart depicts the task dependency among activities. This Gantt chart is excellent for a modest project; as the project grows larger and more complicated, the chart becomes congested, making it harder to track activities and progress.
Components of a Gantt Chart
The following are a few common components (or columns) of a Gantt chart:
- Task/Item Name: This is the name of the task.
- Planned Start Date: This is the planned start date of the task.
- Planned Duration: This is the duration of the task.
- Planned Effort: This shows how many work hours a task is required to complete.
- Percent Complete: This data shows how much the task has been completed.
- Owner: This is the name of the employee assigned to the task.
- Task Dependencies: This shows the task dependencies.
Benefits of Gantt Charts
Schedule deviations are quite common in projects, and the Gantt chart allows the project teams to take corrective actions and align themselves to the planned milestones.
Gantt charts have many benefits; some of them are as follows:
- Easy to create
- No learning curve
- A good communication tool
- Avoids resource overload
- Monitors project progress
- Promotes transparency
- Creates accountability
- Improves productivity
- Helps manage resources
Construction of a Gantt Chart
Gantt Chart is a kind of bar chart where:
Vertical Axis: The tasks are listed on the vertical axis
Horizontal Axis: The width of bars on the horizontal axis shows the activity duration.
Let’s construct a Gantt chart.
Below is a step-by-step procedure to develop a Gantt chart.
Step 1: List the activities planned for a work package as part of the WBS (Work Breakdown Structure).
Let’s consider a sample work package below for a simple product logo design project:
I am marking the activities alphabetically. This would help prepare the schedule network diagram and calculate the critical path.
- Design
- Analyze the tool/software for the design (A)
- Prepare sample logos (B)
- Testing
- Validate logo (C)
- Provide QA sign-off (D)
- Review & Approval
- Review the logo designs (E)
- Finalize the logo (F)
- Approve the logo for product use (G)
Step 2: Estimate the duration for all these activities for the Optimistic, Pessimistic, and most likely time expected (I have considered business days in the table below).
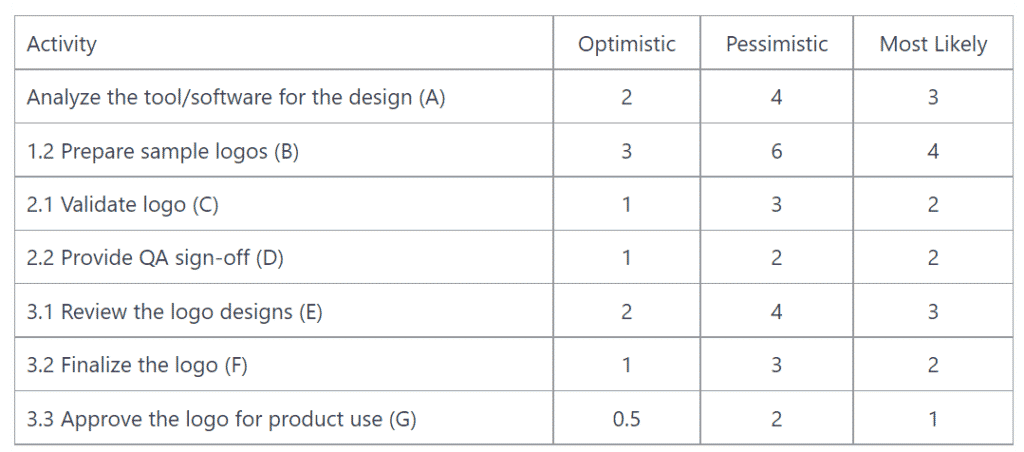
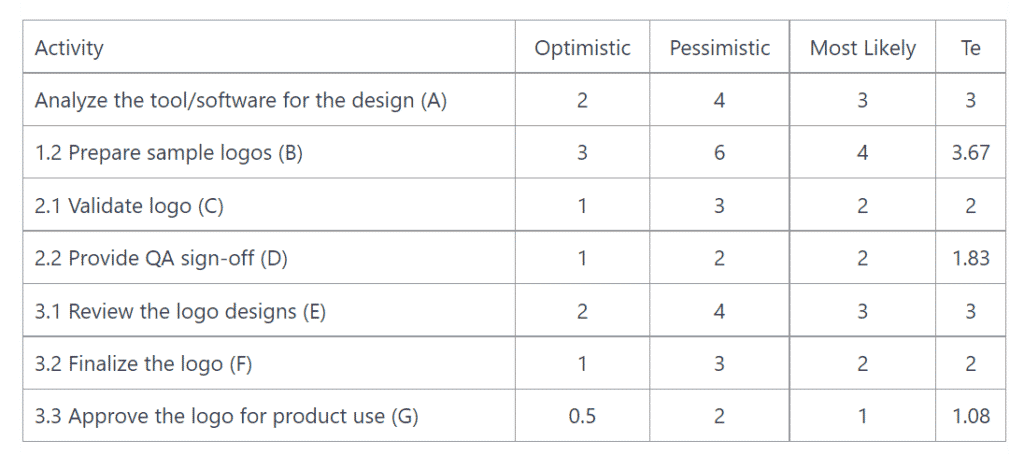
Step 3: Calculate the Total Estimate for each of the above activities using the PERT Beta Probability Distribution formula:
Te = (O + 4M + P) / 6
Step 4: Identify the predecessor for the activities
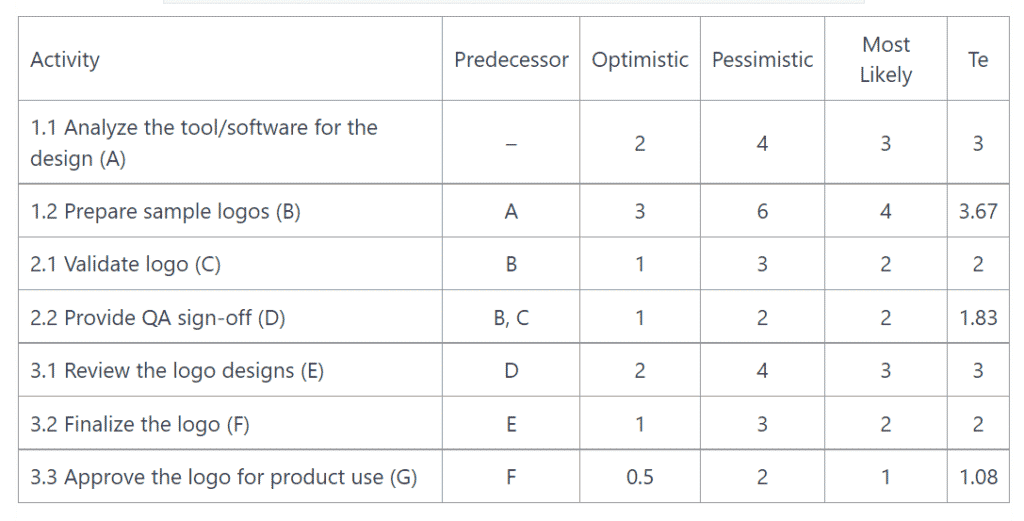
Step 5: Identify the critical path using a schedule network diagram.
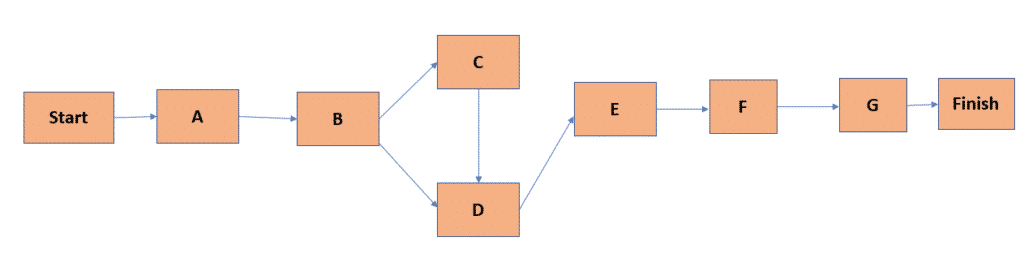
A -> B -> C -> D -> E – > F -> G: Total Duration: 16.58 days (Critical Path)
A -> B -> D -> E -> F -> G: Total Duration: 14.58 days
Step 6: Now, translating these details into the chart yields a result as seen below:
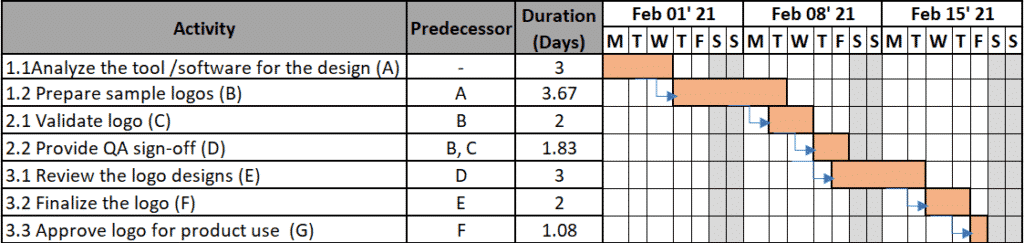
For non-working days, the duration looks longer, but in reality, only the working days are used for project planning.
Gantt charts also demonstrate how the project’s schedule is progressing. The finished work may be seen on the Gantt chart in the shaded area on the left side (green area) of the chart below:
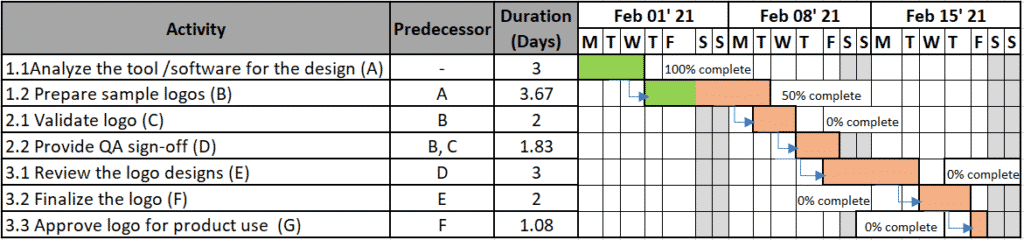
The above chart provides a visual presentation of the project schedule. You can see if the project is on schedule, ahead, or lagging. This view allows the project manager to take preventive or corrective actions as necessary.
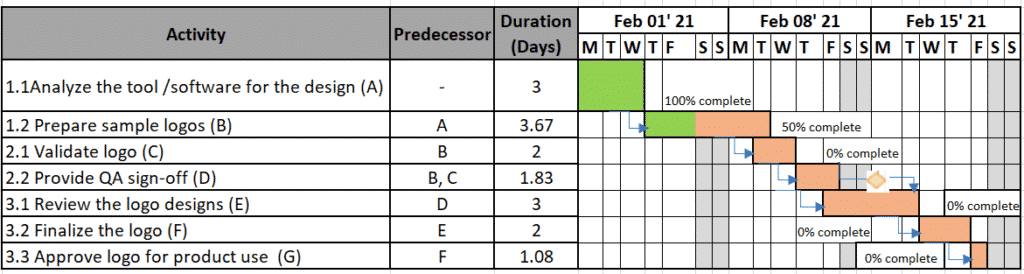
Gantt charts can also include the names of the team members working on each activity.
A Gantt chart shows milestones with a diamond shape.
Uses of the Gantt Chart
The Gantt chart can be used to plan projects. Creating a sophisticated Gantt chart is simple with today’s project management software. You can view the following on a Gantt chart:
- Scheduled work
- Completed work
- Project start and end date
- Team member assignment
- Task duration
- Task dependency
- Etc.
All project management software, task management platforms, CRM platforms, and schedule management software use the Gantt chart in one form or another.
Gantt Chart Vs Network Diagram
Gant charts and network diagrams are useful tools in task management and help create project timelines.
The main distinction between the two tools is that the Gantt chart is a bar chart, but the network diagram is a flow chart that depicts the project’s sequential workflow.
The Gantt chart is good for visually representing task durations, and the network diagram is excellent for visually representing task dependencies.
A Gantt chart is better for task management, whereas a network diagram is better for planning and control.
The Gantt Chart’s Limitations
A Gantt chart has the following limitations:
- Gantt charts may not be helpful in complex projects where the work packages have many activities and dependencies. In this case, the Gantt chart would become clumsy.
- Though the Gantt charts show the expected activity duration, they do not help find the resources required to complete the task.
- There is little to no flexibility in project planning using the Gantt chart.
- Any change in the project plan makes it difficult to update the Gantt chart, and it is time-consuming.
- Though activity duration is estimated before developing the Gantt chart, no rationale can be seen on the Gantt chart for this estimation.
- A Gantt chart does not show the impact of the delayed activity.
FAQs on Gantt Chart
#1. Can I Create a Gantt Chart in Excel?
Microsoft Excel allows the creation of a Gantt chart and provides many templates for Gantt charts. You can import them and use them for your project.
You can get some premium Gantt chart templates from here:
https://templates.office.com/en-us/agile-gantt-chart-tm55723235
Google Sheets also provides the facility to create a Gantt chart. You can create a Gantt chart using Google Sheets for your simple project.
#2. Who Can Use a Gantt Chart?
Gantt charts are useful in agile, waterfall, and hybrid project management. Anyone who belongs to any industry can use it to visualize the tasks.
A Gantt chart can be used by:
- Project manager
- Team leader
- Planner
- Scheduler
- Supervisor
- Manager
- And more.
Conclusion
You must keep a project on track, foresee any delays, and swiftly perform preventive or corrective actions to bring the project back on schedule. A Gantt chart can assist you with this. A Gantt chart is a bar chart that depicts a project’s timeline. Several software solutions available these days make creating Gantt charts much easier than it used to be.
While the Gantt chart may not be the perfect tool to assist a project manager in capturing all the details for the project schedule, it helps guide the manager to make informed decisions on the schedule.
The Gantt chart is referred to as a bar chart in various places in the PMBOK Guide 6th Edition. You might see a few questions on this topic on your PMP exam.

I am Mohammad Fahad Usmani, B.E. PMP, PMI-RMP. I have been blogging on project management topics since 2011. To date, thousands of professionals have passed the PMP exam using my resources.