The schedule performance index and cost performance index are important metrics used to measure the project’s progress. By seeing these figures in the progress reports, stakeholders will know how the project is progressing and whether any necessary corrective or preventive actions are required.
In today’s blog, we will discuss these performance parameters with formulas and examples so you can understand them well.
Schedule Performance Index (SPI)
The schedule performance index (SPI) shows how you are progressing as compared to the planned project schedule. The schedule performance index gives you information on your project’s time efficiency.
According to the PMBOK Guide, “The schedule performance index (SPI) is a measure of schedule efficiency, expressed as the ratio of earned value to planned value.”
The schedule performance index is the ratio of earned value to planned value. It shows the schedule efficiency of the project. The performance duration can be a specific period or a complete project.
Formula for Schedule Performance Index (SPI)
You can find the schedule performance index by dividing earned value by planned value.
Schedule Performance Index = (Earned Value) / (Planned Value)
SPI = EV / PV
Make sure that you add all tasks while calculating the schedule performance index. Sometimes, you may only consider those on the critical path and ignore the rest, which will give you an incorrect result.
Therefore, make sure that non-critical activities are included.
How to Calculate Schedule Performance Index
You will first find the earned value and then the planned value. Afterward, you will divide the earned value by the planned value. The result is the schedule performance index.
“Earned value” is the value of completed work, and “planned value” is the value of the work as per the plan.
SPI Interpretation
As the SPI is a ratio, it can be equal to one, less than one, or more than one.
You can interpret the SPI in the above three cases as follows:
- If the SPI exceeds one, then the project is ahead of schedule. You have completed more work than planned.
- If the SPI is less than one, then the project is behind schedule. You have completed less work than planned.
- If the SPI is equal to one, then the project is on schedule. The completed work is equal to the planned work.
Schedule Performance Index (SPI) Example
You have a project to be completed in 12 months, and the budget is 100,000 USD. Six months have passed, and 60,000 USD has been spent, but upon closer review, you find that only 40% of the work has been completed so far.
Find the schedule performance index and deduce whether the project is ahead or behind schedule.
Given in the question:
Actual Cost (AC) = 60,000 USD
Planned Value (PV) = 50% of 100,000 USD
= 50,000 USD
In the question, the planned value is not given. However, the project duration is 12 months, and six months have passed. In this situation, you can assume that the budget was distributed evenly each month. Therefore, in six months, 50% of the budget will have been spent.
Earned Value (EV) = 40% of 100,000 USD
= 40,000 USD
Now,
Schedule Performance Index (SPI) = EV / PV
= 40,000 / 50,000
= 0.8
Therefore, the schedule performance index is 0.8.
You are behind schedule since the schedule performance index is less than one.
Cost Performance Index (CPI)
The cost performance index helps you analyze the project’s cost efficiency. It measures the value of the work completed as compared to the actual cost spent. The cost performance index specifies how much you are earning for each dollar spent on the project. It shows how well the project is sticking to the budget.
According to the PMBOK Guide, “The cost performance index (CPI) is a measure of the cost efficiency of budgeted resources, expressed as a ratio of earned value to actual cost.”
The cost performance index is the ratio of earned value to actual cost. It shows the cost efficiency of the project. The performance duration can be a specific period or a complete project.
Formula for Cost Performance Index (CPI)
You can calculate the cost performance index by dividing the earned value by the actual cost.
Cost Performance Index = (Earned Value) / (Actual Cost)
CPI = EV / AC
How to Calculate Cost Performance Index
You will first find the actual cost spent and then the earned value. Afterward, you will divide the earned value by the actual cost. The result is the cost performance index.
Earned value is the value of completed work, and the planned value is the value of the work as per the plan.
CPI Interpretation
As the CPI is a ratio, it can be equal to one, less than one, or more than one.
You can interpret the CPI in the above three cases as follows:
- If the CPI is greater than one, then the project is under budget. You are earning more than you have spent.
- If the CPI is less than one, then the project is over budget. You are earning less than you have spent.
- If the CPI is equal to one, then the project is proceeding as per the planned spending.
Example of Cost Performance Index (CPI)
You have a project to be completed in 12 months, and the project budget is 100,000 USD. Six months have passed, and 60,000 USD has been spent, but upon closer review, you find that only 40% of the work has been completed.
Find the cost performance index for this project and deduce whether you are under or over budget.
The following information is given in the question:
Actual Cost (AC) = 60,000 USD
Planned Value (PV) = 50% of 100,000 USD
= 50,000 USD
Earned Value (EV) = 40% of 100,000 USD
= 40,000 USD
Now,
Cost Performance Index (CPI) = EV / AC
= 40,000 / 60,000
= 0.67
Therefore, the cost performance index is 0.67.
This means you are earning 0.67 USD for every 1 USD spent since the cost performance index is less than one. Therefore, you are over budget.
Cost Performance Index and Schedule Performance Index Comparison Table
The following table shows the difference between SPI and CPI.
| Item | Schedule Performance Index | Cost Performance Index |
| Definition | SPI measures the efficiency of time utilization in a project. It is the ratio of the earned value (EV) to the planned value (PV). | CPI measures the efficiency of cost utilization in a project. It is the ratio of the earned value (EV) to the actual cost (AC). |
| Formula | SPI = EV / PV | CPI = EV / AC |
| Interpretation | SPI < 1: Behind schedule; SPI = 1: On schedule; SPI > 1: Ahead of schedule | CPI < 1: Over budget; CPI = 1: On budget; CPI > 1: Under budget |
| Emphasis | Emphasizes time performance and project scheduling. | Emphasizes cost performance and budget management. |
| Importance | Important for projects in which meeting deadlines is critical. | Important for projects in which staying within budget is critical. |
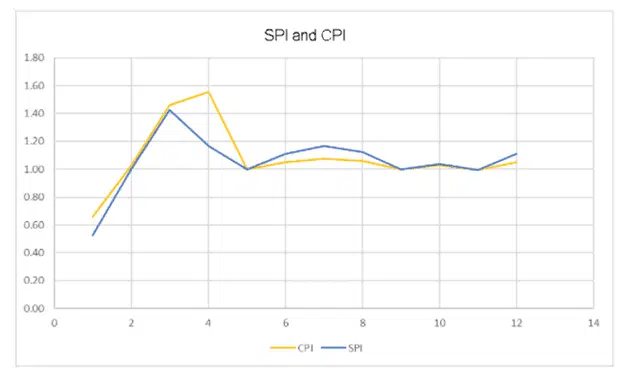
Cost Performance Index and Schedule Performance Index Comparison Chart
The below comparison chart shows SPI and CPI graphically. Project managers use this chart to review the progress and communicate with stakeholders.
This chart shows how the project is progressing regarding cost and schedule performance and recommends corrective and preventive actions.
How SPI & CPI Differ from SV & CV
You have studied variance (i.e., SV and CV) and indexes (i.e., SPI and CPI). However, these sets of parameters do not provide the same information.
Both are required because there is a difference between variances and indexes: the former provides the difference between the two values, and the latter provides a ratio.
The result comes in dollar form in cost or schedule variance. A negative variance means the project is in trouble. However, the project is in good shape if the variance is positive. The problem with variance is that you cannot compare the health of one project with another, even if your organization has many projects.
Therefore, you will use the performance index to compare the health of a project against many other projects. The performance index is the ratio between the parameters. A glimpse of these ratios will help you determine the project’s health, which will make it easier to compare the relative health of many projects. Therefore, indexes increase efficiency.
Summary
Schedule performance index and cost performance index help you analyze the project’s progress. These measures can help determine whether your performance is up to standard. You are doing well if the ratio is higher than one. If the ratio is less than one, then there is a problem with the project, and you should take corrective action. In ideal conditions, the ratio should be one.
This point is important from a PMP exam point of view.
This blog post is the fourth in a series of seven on Earned Value Management and project forecasting. Please read through my previous three posts before reading this post if you’re coming here from a search engine or a referral.
The following are the links for other blog posts:
- Earned Value Management
- Elements of Earned Value Management
- Budget at Completion in Project Management
- Cost Variance in Project Management
- Schedule Variance in Project Management
- Cost Performance Index in Project Management
- Schedule Performance Index in Project Management
- Schedule Variance and Cost Variance
- Schedule Performance Index and Cost Performance Index (You are here)
- Estimate at Completion
- Estimate to Complete
- To Complete Performance Index

I am Mohammad Fahad Usmani, B.E. PMP, PMI-RMP. I have been blogging on project management topics since 2011. To date, thousands of professionals have passed the PMP exam using my resources.


Ihave question. Now a days every project Management organization has Project Control department which also focus on cost and schedule and same thing is the primary responsibility of project manager. what is the primary difference between project manager and project control manager. Please elaborate.
If our cost performance remained 0.95 for the first three months, what will be our course of action as a project manager?
I have a question. If we our cost performance for two months remained 1.07, What will be our course of action as a project manager?
One of the critical tasks of a project is laying an electrical cable 60,000m in length. So far, 30,000m has been laid, so actual work is 30,000 of 60,000m. The budgeted cost for the task is $90,000. The actual expenditure so far is $60,000. The task duration is 10 weeks, and work on this task started 7 weeks ago.
1. Calculate the Planned Value (PV)
2. Calculate the Earned Value (EV)
3. Calculate the Schedule Performance Index (SPI)
4. Calculate the Cost Performance Index (CPI)
WOW, thank you sir, it is a nice explanation. I got the idea in a good way.
Which of the following ideal at the end of a project; a. AC=EV. b. EV=PV. c. AC=PV. d. CPI=1
At the end of the project you will earn all planned value, so as per my understanding EV = PV will be the right answer.
Hello,
If you have a project that is complete and the CPI=1 and the SPI=237 on an expedited project is this a valid way to represent that the project completed significantly ahead of schedule?
Are you sure that SPI = 237?
If SPI = 2 this means you have completed the project in half time.
When I look at the formulas and the examples, it seems to assume that costs are spread evenly throughout the project (eg. 3 consultants working from start to finish of the project).
but in fact most projects have costs varying from month to month. eg. there may be purchase of software or equipment that spikes costs in certain months.
would these situations be accurately covered by EV, PV CPI etc?
In that you will see your schedule to find the value of PV, you have the AC, and you can find the EV. Once you get these figure, you can run your analysis.
Incase you are ahead schedule, why would you calculate SPI..You should party till next milestone arrives. :)
If the difference is small, it is okay otherwise you must find the cause for it.
the key to calculate spi/cpi at work package level is to know the percentage completion of work package. for example – planned efforts are as follows for each work item – requirement gathering = 40 hrs, design = 100 hrs. Build and Test = 200 hrs. %completion of each work item, requirement gathering = 100%, design = 40%, build and test = 20%. So, work package completion can be calculated as – (40*1+100*0.4+200*0.2)/(40+100+200) = 120/340 = 6/17 = ~30%.
once you know the percentage completion at package level, you can calculate spi/cpi at package level by summing up efforts of each items and considering earliest start date and latest finish date of the project/package.
Well said Alam.
Dear Farhad,
Thanks for your blogs. I have just started reading PMP material & this is really well explained.
But i am completely confused with this eg., could be as i am just understanding concepts. In the real world this scenario doesn’t seem to be possible, at the same time it also raises a question for me.
If i try to make this real, as an eg. i have to consider EV & CV as 20000 and PV as 80000. This means that i had considered 80% completion of work when actually only 20% has been completed. This is really bad but we say that having CPI > 1 means we are on schedule. Aren’t these 2 scenarious completely contradictory. Here we are saying that Cost spent is as per expectation but projection which has been done (PV) is completely wrong. Thus how can CPI justify perfectness of project schedule or even mean that cost is being spent as expected.
Please guide !!
Thanks and Regards,
Reshma
There is a difference between real world situation and virtual data. While making a question, you may select any virtual data to check the analytic skill of a candidate. You should not worry about it.
another question please :
In calculating EV i use % complete in terms of quantity, ex. we have a planned quantity of 1000 cubic meters of reinforced concrete to be finished in 8 months with BAC of 6000000 , as to date we completed 100 cubic meters so the EV = 0.1(100/1000) * BAC
is this right and accurate ?
Regards
Let us use the simple mathematics.
The cost of 1000 cubic meter concreting is 6,000,000 USD.
This means cost of 1 cubic meter concreting will be = 6,000,000/1000
= 6,000 USD
Therefore, the cost of 100 cubic meter concreting = 100 *6,000
= 600,000 USD
Hope it helps.
Yes sir it really helped
Thanks a lot!!!
But sir can SPI & CPI be 2 or more or can it be negative?
And sir what will be the CPI & SPI to the same problem
If the same activity was to be completed in 20 days but it got completed in 140 days
SPI and CPI depends on EV, PV and AC. These are ratios and can not be negative.
Regarding your next doubt, you can analyse it with same logic.
Thank you sir…but cal elaborate a little…
Can SPI be 2?
And for the second question
Is SPI = 20/140 = 0.14
Acc to the logic?
The logic says, SPI = EV/PV
Mathematically you can come with any number and get the result.
Great explanation Fahad !
One question I have..
If SPI is less than 1.. say 0.6… of course it means we are behind the schedule..does it always mean that deliverable have not been met ?
Can it be possible that project is complete with all deliverable accepted by customer.. but SPI is still 0.6 ?
Thanks
Deliverable can be met even if the project is behind schedule.
It is not possible to complete the project and spi is still 0.6 because once the project is complete, no work left and spi = 1.
How is that possible Fahad – Deliverables are met, but the project is behind schedule? Can you elaborate?
Suppose you are working a multi-year project, and you have to deliver some deliverables at some intervals.
And if you deliver a few of these deliverables late, you will say that although the deliverables are met but the project is behind schedule.
Still could not get it. Let us a say Project X has 3 deliverables – D1, D2 and D3. D1 will be on Day 15, D2 will be Day 30 and D3 on Day 45.
If I am saying on 45th Day that D3 will be delivered on Day 50, then – Project is behind schedule. But are the deliverables met? No. Then saying that D3 is met – is not it wrong?
In such a case – yes, D1 and D2 are met and SPI will be 1 for them, but will be D3 be of SPI = 1? And more importantly will project be at SPI = 1? No. As Cumulative SPI will pull it below 1.
Or am I understanding differently?
Yes, you’re right.
In this case you were proceeding in correct direction until you deliver D2, however, after delivering it you deviate and the schedule is delayed.
Thanks Fahad.
The correct wordings would be – Project can be delayed and SPI can&will be below 1, however some deliverables can be met, but NOT all. When i read first time, it felt like “Project can be delayed, but deliverables are met – meaning all”, which is not the case.
Btw, what will be you take on CPI in such a case for D1, D2, D3 and the complete Project after the project is delivered (i.e.,delayed and delivered)? Will it be 1 for all or different?
Regarding CPI, you need to see how much you have earned and how much has been spent.
I have spi and cpi
1-then my teacher say why[spi and cpi ]is bad ?(or why cpi , spi bad indicator ?)
2-and what approach for Alternative [cpi , spi]?
Thanks
SPI and CPI are just an indicator that in which direction your project is leading. CPI and SPI are good or bad, it depends in condition of your project.