Processes naturally have variations, which can be common cause variations or special cause variations. Effective project management requires efficiently managing these critical performance shifts.
The variance shows the spread of data. A zero variance indicates identical results, though this is rare. In significant variation, data points are spread out on charts, while in minor variation, data points are closer. Variance is always non-negative, representing the degree to which numbers deviate from their average value. Variation is key in statistics, quality management, genetics, and biology.
Common factors causing performance variances in projects include:
- Changes in project scope
- Resource shortages
- Inaccurate estimates
- Misidentification of scheduled activities
- Flawed project reviews
- Ineffective project-management processes
- Insufficient risk assessments
- Poorly managed change control
- Regulatory changes
- Evolving business needs
- Shifts in end-user requirements
- Changes in market conditions
Addressing variation can be challenging, as it is often unclear whether intervention is necessary. Trying to correct every variation can lead to a cycle of constant adjustment. Dr. W. Edwards Deming described this as “tempering the process,” a counterproductive practice that can degrade quality rather than improve it. Avoiding tempering is essential for maintaining quality.
Variation sources can be common cause variations (e.g., mild health conditions, like coughs or colds) or special cause variations (e.g., significant events, like COVID-19).
What Are Common Cause Variations?
Common cause variations are the inherent fluctuations that consistently affect a process, creating a stable, repeatable distribution over time. This variation is an intrinsic part of the process and cannot be easily controlled. As noted by Harry Alpert in 1947, common cause variations represent natural, expected issues in a system, and no specific actions can entirely prevent this variance or failure.
Characteristics of Common Cause Variations
The following are the key characteristics of common cause variations:
- Predictable within a probabilistic range
- Rooted in systemic factors intrinsic to the process
- Based on historical data and patterns (though not highly regular)
- Individual values lack significance in isolation, as high and low values fall within a predictable range
Common cause variations are contained within three standard deviations from the process mean, covering approximately 99.73% of expected values. On control charts, these variations appear as points scattered within control limits, signaling no immediate corrective action but a need for a managed, foundational approach to improvement.
A fundamental change to the process is necessary to reduce common cause variations. When only common cause variations are present on a control chart, the process is “statistically stable.”
Benefits of Understanding Common Cause Variations
Identifying and analyzing common cause variations can provide several advantages, such as:
- Predictable Short-Term Outcomes: When a process operates within control limits, variations are minimal, thus leading to consistent, smooth operations.
- Process Capability Assessment: A stable process with common cause variations within specification limits reliably meets performance standards.
- Opportunities for Improvement: Analyzing common cause variations highlights areas for fundamental adjustments, thus potentially reducing variability and enhancing consistency.
Examples of Common Cause Variations
Suppose you estimated 10 days to complete a construction project, but due to climatic conditions, it took 11 days. Since this minor delay is within a predictable range, it is the common cause of variation.
Below are further examples of common cause variations in a project:
- Unclear scope definition
- Insufficient design detail
- Limited management oversight
- Incomplete procedures
- Weather conditions (e.g., temperature, humidity)
- Computer response-time fluctuations
- Suboptimal working conditions
These variations are generally consistent and predictable, as they arise from inherent factors within the process or environment.
What Are Special Cause Variations?
Special cause variations are unpredictable fluctuations that can significantly impact part of a process. Unlike common cause variations, these variations are sporadic and unexpected, and they arise from specific, identifiable issues within a system. The term “special cause variations,” coined by W. Edwards Deming, is also called an “assignable cause.”
Special cause variations are not part of the normal process, and they occur randomly. These issues are generally linked to system, process, or method deficiencies and can often be corrected by addressing the specific element or process.
Characteristics of Special Cause Variations
The following are the key characteristics of special cause variations:
- Occur suddenly and unexpectedly within the system
- Unpredictable and can disrupt normal operations
- Fall outside historical experience, thus indicating a new or novel issue
On a control chart, special cause variations often appear outside the control limits. When such variations are detected, they signal the need for immediate investigation and corrective action to prevent future disruptions.
Benefits of Understanding Special Cause Variations
Identifying and analyzing special cause variations offers several key advantages:
- Timely Problem Identification: Recognizing special cause variations enables quick resolution of unexpected issues, thus minimizing their impact on performance.
- Informed Decision-Making: Understanding these variations provides insights for data-driven decisions on resource allocation and process adjustments, thus enhancing operational efficiency.
- Enhanced Process Control: Distinguishing special cause variations allows for targeted interventions, thus improving process stability and quality, as well as boosting customer satisfaction.
Examples of Special Cause Variations
Tom usually commutes to work in 10 minutes. However, unexpected heavy traffic extended his travel time to 20 minutes on a particular day.
Other examples of special cause variations include sudden laptop malfunctions, system crashes, and power outages.
In project management, tracking deviations between the planned timeline and actual progress helps assess the project’s health. Control charts are valuable tools for differentiating common cause from special cause variations.
Importance of Understanding Special Cause Variations
Understanding special cause variations is necessary for maintaining control and quality in any process.
It can helps project managers:
- Know When to Take Corrective Action: Recognizing and addressing special cause variations can help you prevent small issues from escalating, thus enabling timely adjustments that protect process quality.
- Provide Data for Process Improvement: Analyzing special cause variations equips teams with precise data to recommend, assess, and implement targeted improvements, thus preventing recurrence and strengthening the process overall.
If no special cause variations exist, then the process is “in control.” Making changes when a special cause variation is absent (known as “tampering”) can increase unnecessary variability, degrade quality, and destabilize the process. Properly identifying special cause variations will ensure that adjustments are meaningful, thus maintaining process efficiency and product consistency.
Common Cause Variations vs. Special Cause Variations
The following table shows key differences between common cause and special cause variations.
| S. No. | Common Cause | Special Cause |
| 1 | Variation is natural and within the historical base. | Variation is unnatural and outside of the historical base. |
| 2 | It affects the whole process. | It affects some of the process output. |
| 3 | It has a repeatable and steady distribution over time. | It is irregular and inconsistent. |
| 4 | Variance is in control. | Variance is shown by one or more points and is outside of the control limits. |
| 5 | There is a predictable process. | The process cannot be predicted. |
| 6 | Detailed analysis is required to identify the problems. | It can be identified quickly and can be either beneficial or detrimental. |
| 7 | It requires management action and can correct 85% of the problems. | It can fix 15% of process problems. |
| 8 | Examples are unsuitable procedures, poor design, insufficient machine maintenance, ambient temperature, etc. | Examples are incorrect machine adjustment, operator falling asleep, computer crash, damaged part, defective batch of raw materials, etc. |
Common Cause Variations and Special Cause Variations Charts
A control chart is a graphical display of data over time, set against control limits, with a centerline to help detect trends in the plotted values.
Control charts illustrate how a process performs over time and can help you determine whether it remains in control. When all measurements fall within the established control limits, a process is considered to be “in control.”
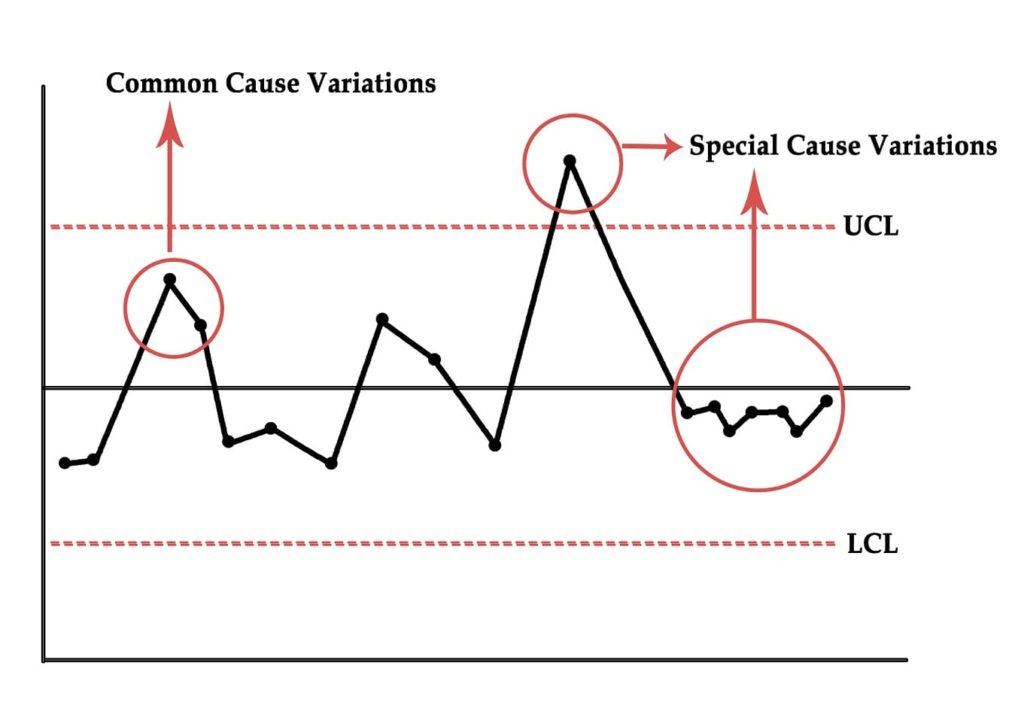
The chart above indicates that the data points are clustered around the mean and remain within the control limits, thus suggesting that the process is stable. However, if data points fall outside the control limits, this signals an issue that requires corrective action to bring the process back under control.
How to Manage Common and Special Cause Variations
Once variations are identified, taking appropriate steps to address them effectively is crucial. This involves differentiating between common cause variations and special cause variations, as each requires a distinct approach.
Managing Common Cause Variations
To minimize common cause variations, you should focus on implementing long-term process changes.
These changes can include:
- Process Redesign: This includes analyzing and restructuring the workflow to eliminate inefficiencies and enhance consistency.
- Standardization: This includes establishing standardized procedures and protocols to minimize variability in output and performance.
- Training and Development: This includes providing ongoing training to employees to ensure that they are well-equipped to follow new processes and understand best practices.
For example, consider health-related issues such as fever caused by common ailments like coughs, colds, and malaria. These variations can be addressed by promoting preventive measures such as vaccinations, improving sanitation, and increasing public awareness about health practices. Similarly, adopting a proactive approach to process improvement in an organizational context can lead to more stable performance and reduced variation over time.
Managing Special Cause Variations
You can follow these steps to manage special cause variations:
- Root Cause Analysis: Investigate the specific source of variations through data collection, interviews, and process reviews.
- Immediate Corrective Action: Implement targeted actions (e.g., halting production and assessing material quality) to resolve identified issues promptly.
- Monitoring and Follow-Up: Continuously monitor the process after corrective actions to ensure effective resolution and a return to control.
Effectively minimizing variation requires understanding its common or special nature and appropriately addressing it. Implementing long-term process improvements for common cause variations and contingency plans for special cause variations can enhance process efficiency and quality.
Conclusion
Understanding common cause variations and special cause variations is essential for effective process management. Identifying the type of variance present in a system is crucial, as the appropriate corrective actions differ significantly between the two. Using control charts is valuable for distinguishing between common cause variations and special cause variations of variations, thus enabling organizations to take informed action.
Organizations can enhance stability, improve quality, and optimize performance across their processes by addressing common cause variations with long-term improvements and responding to special cause variations with targeted interventions.
Further Reading:
- Quality Assurance Vs Quality Control
- Control Chart Vs Run Chart
- Grade Vs Quality
- A Short Guide on the Seven Basic Quality Tools
- Cost of Quality: Cost of Conformance and Cost of Nonconformance
Reference:
- Using Control Charts to Detect Common Cause Variations and Special Cause Variations
- Distinguishing Between Common Cause Variations and Special Cause Variations in Manufacturing Systems
This topic is important from a PMP exam point of view.

I am Mohammad Fahad Usmani, B.E. PMP, PMI-RMP. I have been blogging on project management topics since 2011. To date, thousands of professionals have passed the PMP exam using my resources.