Every project follows a pattern of progress, and the S-curve captures it. It gives project managers a clear picture of how work, cost, and performance develop from start to finish. The S-curve isn’t just a chart — it’s a snapshot of project health at any moment.
It helps the project team see how far they’ve come and what’s left to do. Whether you manage construction, engineering, or IT projects, understanding the S-curve improves planning, tracking, and decision-making. It turns complex data into a simple visual that anyone can read.
By learning how to use an S-curve, you gain a better view of your project’s pace, progress, and success.
Key Takeaway
The S-curve gives project managers a clear, visual way to monitor progress and performance. It transforms complex data into easy-to-read insights, making it one of the most practical tools in project management.
1. Why It Matters
- Tracks how a project progresses over time in terms of cost, schedule, and work completed.
- Helps identify delays or overspending early, allowing timely corrective actions.
- Builds confidence with stakeholders through clear, data-driven updates.
2. How It Helps Managers
- Compare planned vs. actual progress to see if the project is on track.
- Forecast future performance and adjust resources or timelines accordingly.
- Improve overall control, communication, and decision-making throughout the project.
What is an S-Curve?
An S-curve in project management is a visual tool that helps managers track progress, costs, and resource use over time. It is called an S-curve because the line tends to form a shallow S shape when plotted. However, the shape varies depending on the project.
An S-curve is a graphical display of cumulative man-hours, cost, progress, or other quantities plotted against time. It may also be called a cumulative distribution chart, velocity diagram, or performance measurement baseline.
Some projects have front-loaded or back-loaded S-curves. A front-loaded curve rises steeply early on when many resources are consumed at the start. A back-loaded curve stays low for a while and becomes steep near the end. Understanding the shape helps you interpret the data.
Why Use an S-Curve?
S-curves are more than just graphs. They offer predictive insights and support informed decision-making. S-curves give you a clear picture of growth, development, and resource allocation, allowing you to anticipate potential issues.
An S-curve is helpful in the following way:
- Project Planning and Scheduling: The curve shows planned progress and helps you see when key phases should occur.
- Budget Management: By plotting costs over time, an S-curve helps you control expenditures and forecast when major spending will occur.
- Resource Allocation: You can see when manpower or materials are most needed and plan accordingly.
- Performance Tracking: Comparing actual progress against the planned curve highlights delays or overruns.
- Risk Management: Early deviations on the curve signal potential problems, allowing you to take corrective action.
- Stakeholder Communication: An S-curve simplifies complex project data, making it easier to explain status to stakeholders.
S-curves help you track progress, allocate resources, forecast cash flow, manage stakeholder expectations, and maintain flexibility. In other words, the S-curve is both a monitoring and forecasting tool.
Stages of the S-Curve
Every S-curve passes through distinct phases. Understanding these phases helps you interpret the graph:
- Initial Slow Growth: At the beginning, the curve rises slowly. Teams are forming, plans are being finalized, and early tasks are small.
- Fast Growth: As work ramps up, the curve becomes steep. This is the point of inflection when the project experiences rapid progress and heavy resource use. Major milestones are achieved during this phase.
- Late-stage Slow Growth or Maturity: After the inflection point, growth begins to plateau. Most work is complete, and only finishing touches and approvals remain.
- Stationary Stage: The curve levels off completely, indicating that the project has ended and no further significant progress or resource use occurs.
Recognizing these stages allows you to spot delays and plan for the transition between phases.
Types of S-Curves
Different kinds of S-curves serve different purposes. The most common types include:
1. Baseline S-Curve

The baseline S-curve shows the planned progress of a project over time. It is created before work begins. The baseline curve defines the expected resource allocation and schedule required to finish the project. It serves as your reference point for comparison.
2. Target S-Curve

Once the project starts, changes to the schedule produce a target S-curve. This curve represents the ideal development if all tasks are completed on time and under budget. In an ideal scenario, the target curve intersects the baseline curve at completion. Deviations show where the project is ahead or behind.
3. Costs Vs Time S-Curve

This S-curve plots cumulative expenses over time. It is useful for projects with both labor-intensive and non-intensive work. The curve shows all expenses incurred from start to finish, including payments to vendors and contractors. From this curve, you can estimate cash flow and total project costs.
4. Value and Percentage S-Curves

Value and percentage S-curves compare the amount of work completed with the total work or cost. Absolute quantities like expenses versus time or person-hours versus time can be plotted. Earned value curves help determine how much has already been spent and how much labor is required to complete the project.
5. Man-Hours Vs Time S-Curve

This curve tracks the total number of hours used over the project’s duration. It is ideal for labor-intensive projects. You can compare planned man-hours with actual man-hours to see whether staffing levels are appropriate.
6. Actual S-Curve
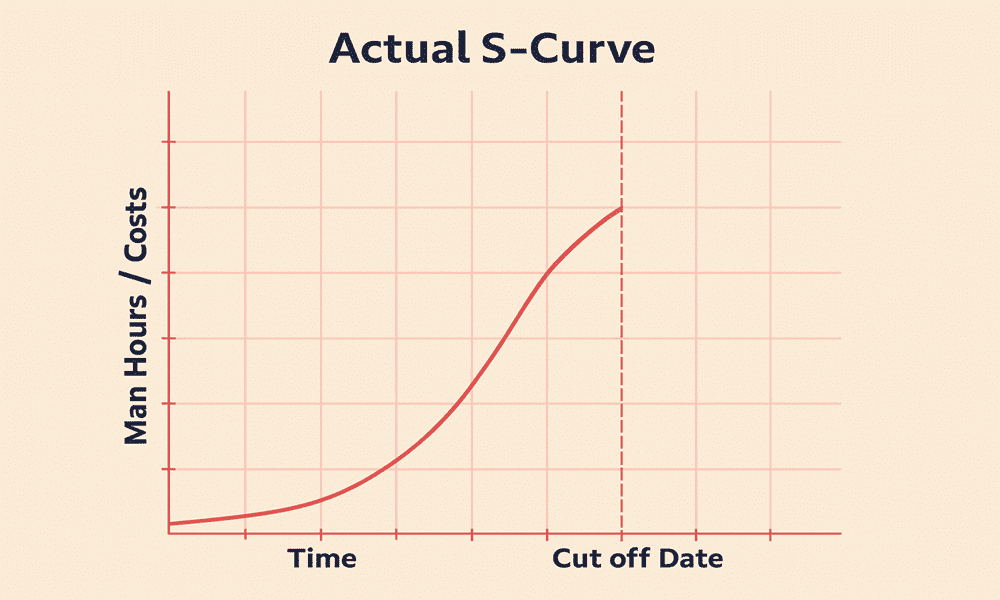
As the project progresses, the production plan is updated, and an actual S-curve is generated. The actual curve displays the real progress and is used to assess performance by contrasting it with the baseline.
There are some other variations as well, such as standard, cost, labor hours, quality, and cumulative S-curves.
S-Curve Uses in Project Management
Performance and Progress Evaluation

The S-curve assesses the project’s progress and performance through earned value management (EVM). To understand the project’s status, progress, and future projections, you must track the following parameters: actual cost, earned value, and planned value.
Compare these parameters with the S-curve to determine whether the project is over, under budget or ahead or behind schedule.
The gap between the target S-curve and the actual S-curve shows how the project progresses. The actual S-curve will be below the target S-curve due to factors like delays in the production schedule. The curves usually only intersect near the project’s end.
Growth Determination

Comparing the baseline and target S-curves can help identify whether the project’s scope has changed. A change in scope may require additional resources and could lead to contract modifications. If resources are fixed, you might need to extend the project timeline to accommodate the changes.
Slippage Determination
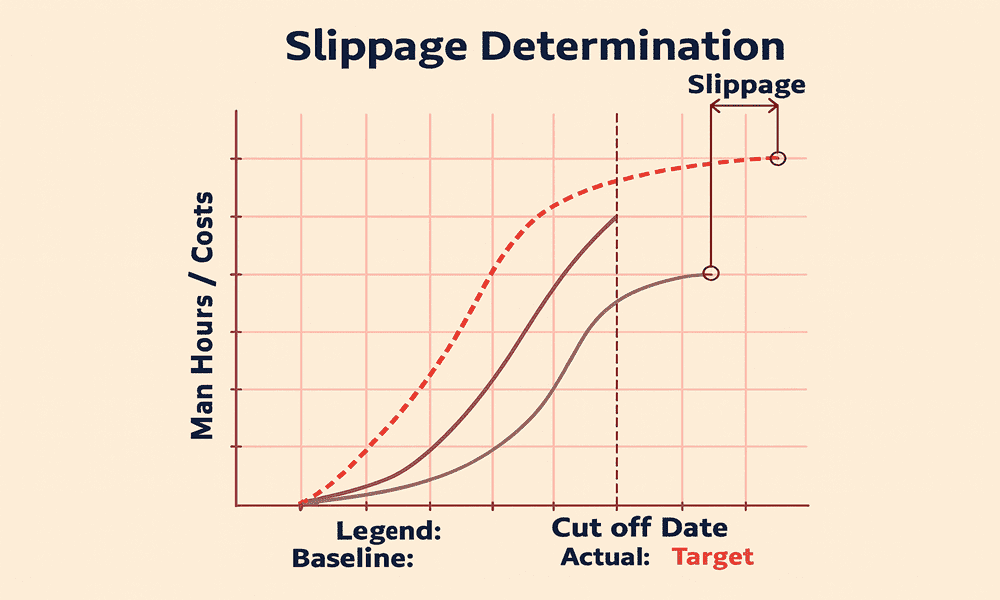
Slippage is the delay in the schedule compared to its planned dates. It is the difference between the task’s actual start or finish dates and the baseline start or finish dates. Slippage happens when the actual dates fall behind the baseline schedule. You can quickly spot slippage by comparing the baseline and target S-curves, as the target S-curve will end to the right of the baseline S-curve.
You may need to allocate extra resources to avoid slippage. If this is not possible, you must raise a change request to update the schedule baseline.
Forecasting Cash Flows
Cash flow refers to the movement of money and its timing. A cash flow curve helps you understand how much money is needed and when payments are due.
How to Create an S-Curve
Creating an S-curve requires careful planning and accurate data. You can follow the following steps to create an S-curve:
- Define Metrics and Goals: Decide what you will track: cumulative cost, hours worked, tasks completed, or other resource measures. Set clear milestones and goals to serve as your baseline. Factors used to determine S-curve parameters depend on the project’s nature, cost, workforce, and work hours.
- Collect Data Regularly: Gather actual data at consistent intervals (weekly or bi-weekly). For example, record actual expenditures and the percentage of work completed. Regular data collection improves the reliability of your curve.
- Choose a Chart Type and Tool: You can use a spreadsheet or project management software to plot a line chart or area chart. Label the horizontal axis as time and the vertical axis as your chosen metric. Many people use Excel, Microsoft Project, or more specialized tools.
- Plot the Baseline Curve: Enter your planned data points and draw the baseline S-curve. This curve will show the expected progress over time.
- Plot the Actual Curve: Add your real data points to the same chart. Use a different color or line style to distinguish the actual curve from the baseline. Compare the two to identify differences. A gap between the curves reveals whether work is ahead of schedule, on track, or delayed.
- Analyze and Adjust: Review the curves regularly. If the actual curve falls behind the baseline, investigate why. You may need to reallocate resources, revise the schedule, or adjust the scope. If the actual curve is ahead of the baseline, ensure that quality and budget are not compromised.
Example: Building a Community Library
Imagine you are managing the construction of a community library. You start by planning all tasks—from architectural design to shelving books—and create a baseline S-curve for cumulative costs and work completed. The baseline predicts that by week 10, you should have spent half of the total budget and completed 50% of the work.
As the project unfolds, you record actual expenditures and progress weekly. By week 10, you find that you have completed only 40% of the work and spent 55% of the budget. When you plot this data, the actual S-curve lies below the baseline in the early stages and then rises more steeply, indicating that you are behind schedule and overspending. You notice that acquiring materials took longer than planned, causing delays. Using the S-curve, you reallocate resources to critical tasks and adjust your procurement strategy.

To illustrate this concept visually, the chart above shows a simplified baseline and actual S-curve. The baseline curve (blue) represents the planned progress, while the actual curve (red) shows what actually happened. The difference between the curves highlights the delay in the middle stages.
Best Practices for Using S-Curves
- Choose the Right Metrics: Pick metrics that reflect the project’s success, such as cost, hours, or percentage of work completed. Use a single metric per S-curve for clarity.
- Maintain Consistent Data Intervals: Collect data at regular intervals to keep the curve smooth and meaningful. Irregular intervals can distort the curve and hide trends.
- Label Your Axes and Curves: Always label the x-axis (time) and y-axis (metric). Use a legend to distinguish between baseline, target, and actual curves.
- Combine with Earned Value Management: Pair S-curve analysis with earned value metrics like planned value, earned value, and actual cost to gain deeper insights into schedule and cost performance.
- Communicate with Stakeholders: Share S-curves during status meetings. Explain what the curves mean and highlight any gaps. These build trust and encourage collaborative problem-solving.
- Adjust Proactively: Don’t wait until the end of the project to review your S-curve. Monitor it regularly and use early deviations to trigger corrective actions.
Frequently Asked Questions (FAQs)
Q1. What is an S-curve in project management?
An S-curve is a graph that plots cumulative data, such as costs or work hours, over time. Its shape shows a slow start-up, rapid progress, and a final taper.
Q2. Why does the S-curve look like an “S”?
The curve looks like an S because projects start slowly, accelerate in the middle, and slow down again near completion.
Q3. Which types of S-curves are commonly used?
Common types include baseline, target, costs versus time, value and percentage, man-hours versus time, and actual S-curves.
Q4. How can I create an S-curve with spreadsheet software?
List dates in one column and cumulative metrics (costs or hours) in another. Plot them on a line chart. Then add actual data to compare with the baseline.
Q5. Can an S-curve predict future resource needs?
Yes. By showing when the curve steepens, an S-curve highlights periods of heavy resource use, allowing managers to plan staffing and budget requirements.
Q6. What does it mean if the actual curve is below the baseline?
If the actual S-curve falls below the baseline, the project is behind schedule or under budget. Investigate delays and consider reallocating resources to catch up.
Q7. Do all projects have S-shaped curves?
No. The shape depends on the project. Some curves are front-loaded or back-loaded. The key is to interpret the curve in the context of your project.
Conclusion
The S-curve is a versatile tool that combines simplicity with powerful insights. By plotting cumulative data against time, you can see how a project unfolds and compare actual performance with planned expectations. Whether you are tracking costs, hours, or the percentage of work, an S-curve helps you monitor progress, allocate resources, forecast cash flow, manage risks, and communicate with stakeholders. Incorporating S-curves into your project management routine not only improves control but also builds confidence with your team and sponsors.
Further Reading:
- Verification vs. Validation
- Grade vs. Quality
- Control Chart vs. Run Chart
- How to Track Project Progress
- What are the Project Baselines?
References:
- The Shape of S-Curve
- What is the S-Curve in Project Management?
- The Philosophy Behind S-curves – Project Control Academy
This topic is important from a PMP exam point of view.

I am Mohammad Fahad Usmani, B.E. PMP, PMI-RMP. I have been blogging on project management topics since 2011. To date, thousands of professionals have passed the PMP exam using my resources.


Thank you
Could you please illustrate regarding banana curve?