A project milestone chart helps project managers visually track project progress and determine how close they are to completing the project.
For example, while driving, we see signs that tell us how many miles are left until we reach our destination. Because of the signpost, we know the distance covered and the remaining distance. In project management, project milestones serve the same purpose; they tell us about the project’s progress.
Although many other tools can provide similar information, the milestone chart is the handiest tool for assessing project status and progress.
Before discussing the milestone chart, let’s understand the project milestones.
Milestones are markers on the project timeline to signify important events, activities, or tasks. Project milestones show the project’s progress and answer the question, “Are we there yet?”
A few examples of project milestones are:
- Project deliverables (e.g., delivery of the first version of an app)
- The start or end of the project phase (e.g., the “planning phase” or “designing phase”)
- An important event (e.g., project-sponsor approval)
What is a Milestone Chart?
Definition: A milestone chart is a graphical representation of project milestones plotted against a timeline. It shows key events, deadlines, or achievements throughout the project lifecycle. Each milestone has a distinct marker that helps in tracking progress and ensuring alignment with project objectives.
This chart offers stakeholders a clear overview of project progress and upcoming milestones. Milestone charts are also known as milestone timelines or milestone diagrams,
A milestone chart shows all major events in a project’s schedule. These events can be the start or end of a phase, equipment delivery, evaluations, or approvals. These milestones give the project team a sense of accomplishment and show how their efforts are contributing to the project’s success.
The milestone chart is a good communication tool. Because it shows the progress visually, the project manager can share the milestone chart with the stakeholders to show them how the project is progressing in the right direction.
Why Are Milestone Charts Important?
A milestone chart tracks project progress. It provides early notice if the project is falling behind schedule, thus allowing for adjustments if necessary. By using milestone charts, you can improve scheduling and help ensure that critical project deadlines are met.
Project managers use milestone charts to communicate the project’s status and progress to stakeholders.
Milestone charts provide valuable insights to project managers and other stakeholders. By highlighting critical milestones, they assist in prioritizing tasks, allocating resources, and adjusting project strategies as necessary to ensure successful project completion.
How to Plan Milestones with a Milestone Chart
- Set Benchmarks: Often, stakeholders cannot differentiate milestones from tasks. A milestone chart differentiates tasks from milestones and shows the key events on the project schedule. You must set benchmarks to classify an event as a “milestone,” as not all events can be milestones.
- Use Templates: Whiteboard tools (e.g., monday.com, nTask, etc.) can help you create and share a milestone chart. You can use a prebuilt template to design your milestone chart. Use a basic template to keep track of the project, and then modify the template later to meet your requirements.
- Assign Columns to Milestones: The milestone-chart template contains columns, each symbolizing a milestone. After creating a milestone, you can modify it and add sections for different milestones. Remember to separate milestones from tasks.
- Set Deadlines and Deliverables: The first row of a milestone chart shows milestone dates. The next columns have a list of the activities that must be completed to accomplish each milestone. You can find deliverables in the last row; these are the results of milestone achievements.
- Update the Milestone Chart Regularly: Milestone charts can be adapted to the project’s needs. As the project progresses, the project manager can revise the chart, based on the situation. A milestone chart is not static, like the project baseline; it can be updated by the project manager whenever it is required.
Milestone Chart Examples
You can create milestone charts using Gantt charts, open-source tools, or commercial project management tools.
The milestone chart can track events, for example:
- The start and end date of the project
- Key project tasks
- The performance of team members
Let’s see an example of a milestone chart for a Minimum Viable Product (MVP) that must undergo proper testing before it is released in the market.
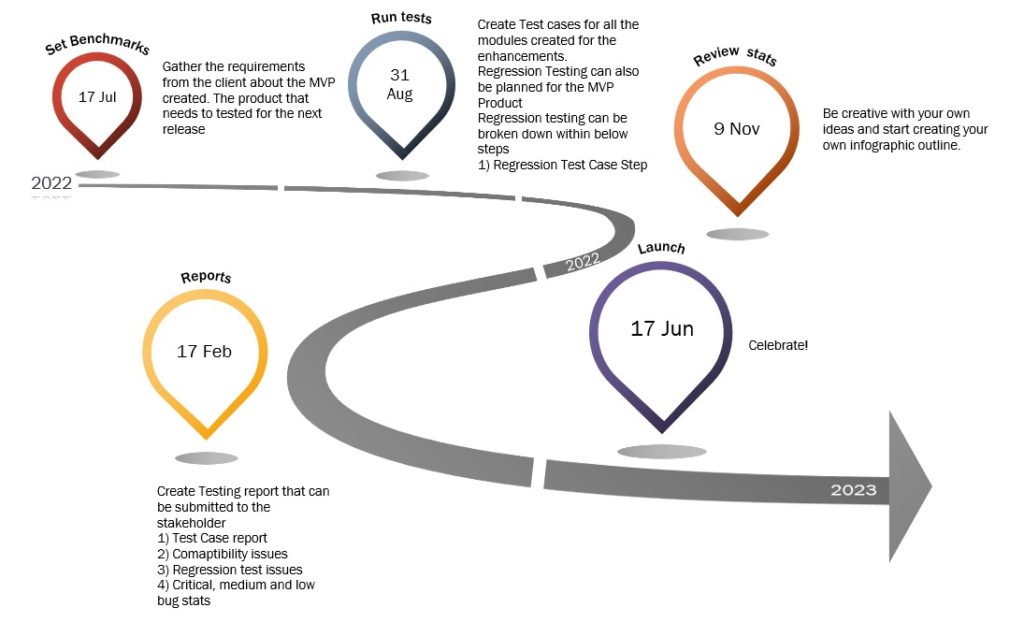
The first milestone is to create a benchmark and gather the requirements for testing the MVP product launch. This can include identifying and understanding the target audience.
The next milestone is to plan and create the test cases for all the modules designed for the MVP.
Regression testing can also be scheduled for the MVP Product as such:
- Regression Test Case Step 1
- Regression Test Case Step 2
Another milestone is creating the Quality Analysis report of the product launched.
How to Create a Project Milestone Chart
The following steps can help you create a milestone chart:
- Define Project Objectives: First, define the project objectives and timeline. Project objectives help team members understand the project outcome. After establishing project objectives, create a basic project timeline, beginning with a start and end date.
- Decide Tasks and Milestones: After creating the preliminary timetable, prepare a task list. Link tasks with dates, so you can track them later and save time. Make sure that you do not miss any tasks. Afterward, identify key events for your projects and decide whether they qualify for milestones. Make a separate list of milestones and get stakeholder feedback.
- Establish Milestones: Before finalizing project milestones, you must first understand them. Many professionals confuse deliverables with milestones. Deliverables are project outputs (e.g., reports, products, etc.). Milestones show the achievement of the deliverables. You must identify all project milestones.
- Develop Project Timeline: You can now put everything in place and develop the project schedule using the tasks, phases, milestones, deliverables, etc. Include all project activities and stages in the timeline and apply the project-management dependencies.
- Get Feedback: You can share the milestone chart with the project team to ensure its robustness and to gain feedback that will improve it further. Make sure that project phases have the required duration to avoid bottlenecks. Once the chart is finalized, you can share it with other stakeholders for their information and feedback.
- Add Details: During the project lifecycle, you can add notes to appropriate tasks or milestones. A milestone chart is never complete; it is a live project-management document that is always updated to stay current with the project. Adding information to the timetable helps the project team track the status and monitor progress.
- Celebrate Achievements: Celebrate whenever the team accomplishes a milestone. Recognize the team’s efforts by celebrating milestones. It motivates team members and increases engagement.
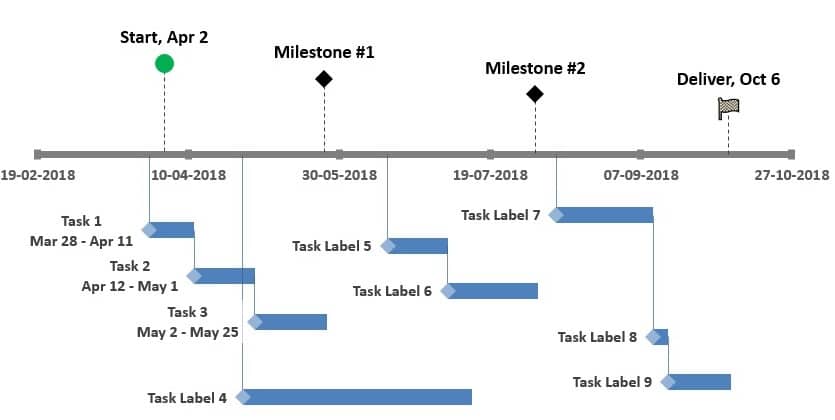
Sample Milestone Chart
Benefits of Using a Milestone Chart
A few benefits of milestone charts are:
- They Monitor Project Progress: The project-milestone chart helps the project manager monitor the timeline, deliverables, and key performance indicators (KPIs). Milestone achievements show the project progress, which stakeholders can compare with the planned progress.
- They Improve Team Cooperation: When a team is spread over a different geographical area, team collaboration is vital. Establishing milestones will align the work and provide direction to team members, so they may collectively achieve the milestone.
- They Recognize Shortfalls: Establishing milestones will help you find bottlenecks in the process and recognize shortfalls. The project manager can then take the necessary preventive and corrective actions to ensure that the project progresses smoothly.
- They Monitor the Budget and Schedule: On-time delivery and budget adherence will show the project’s success. Project managers can compare the planned progress and expenditures against the actual progress and expenditures to find deviations. They can then take the appropriate corrective or preventive actions if required.
- They Improve Stakeholder Engagement: Milestones convey the project status to stakeholders and help gain their approval. Milestone charts are great communication tools. Stakeholders can see the progress visually and provide their feedback.
- They Simplify the Billing Process: Many clients pay their contractors based on milestone achievement. This helps them decide when to send payments to suppliers and other contractors, thus monitoring timely payments to suppliers based on objective criteria.
How Milestone Charts Are Different from Gantt Charts
Milestone charts and Gantt charts serve different purposes and offer unique visual representations of project timelines.
Milestone charts emphasize the key events in the project timeline. They display milestones as points along a horizontal line that represents time, with each milestone marked by a symbol or marker. Milestone charts provide a snapshot of important project milestones (e.g., project kickoff, the completion of major deliverables, or key decision points). They help communicate when key deadlines are met.
Gantt charts are comprehensive and detailed. They show project schedules by breaking down tasks, activities, durations, and dependencies over time. Gantt charts consist of horizontal bars, each representing a specific task or activity. The length of the bar indicates its duration, and its position on the chart shows its start and end dates. Gantt charts provide a visual roadmap of the entire project. They are effective for understanding task dependencies, resource allocation, and monitoring project progress.
While milestone charts focus on highlighting key events, Gantt charts provide a more detailed overview of project activities and their scheduling over time. Both tools are valuable for project management, with their unique visualizations serving different aspects of project planning and monitoring.
Summary
Project milestones are not just markers on a timeline; they are the keys to successful project management. By planning, setting, and tracking milestones, you can stay on track and deliver results that exceed expectations. Milestones promote clarity, accountability, and communication.

I am Mohammad Fahad Usmani, B.E. PMP, PMI-RMP. I have been blogging on project management topics since 2011. To date, thousands of professionals have passed the PMP exam using my resources.


I want to draw a figure for the milestone chart. can you send me editable figures related to the healthcare setting?
Thank you Mohammed for these tips. I love the post. Kindly recommended the best free Gannt software for me?